FENNEC Saharan dust case (June 2011)
Folder: examples/FENNEC_june2011
This is the aerosol-oriented remote-sensing example: a five-bin Saharan dust transport and evaluation workflow for a June 2011 dust outbreak sampled during the FENNEC campaign. It is the counterpart, in the code repository, to the FENNEC dust-column anchor case in the TARSA forward-operator manuscript.
Purpose
Where the ETEX-1 case evaluates inert long-range transport, this example exercises the full aerosol-process extension of TARSA — sedimentation, dry deposition, and wet deposition — and the satellite-collocation and observation-space analysis workflow. It shows how to go from prescribed dust emissions to a comparison against a retrieved satellite aerosol-column product:
- ERA5 meteorology on pressure levels
- prescribed MERRA-2 dust emissions
- a four-day TARSA spin-up under homogeneous Neumann lateral dust boundaries
- a forward TARSA simulation of five dust bins
- vertical integration to a dust-column quantity
- collocation against the GRASP/POLDER Level-3 coarse-insoluble column product
- scatter and daily map diagnostics
It is interpreted as a less constrained forward aerosol-column evaluation under realistic meteorology and prescribed emissions — not as a stand-alone validation of dust sources, because the emissions remain prescribed from MERRA-2.
What this case uses
| Setting | Value |
|---|---|
| Region | North Africa, lon = -20 … 12, lat = 12 … 34 |
| Model window | 2011-06-12 to 2011-06-25 |
| Spin-up | 2011-06-12 to 2011-06-15 (evaluation starts 2011-06-16) |
| Meteorology | ERA5, 25 pressure levels |
| Emissions | MERRA-2 dust emissions (DUEM001–DUEM005) |
| Initial / lateral conditions | zero IC, homogeneous Neumann (neumann0) lateral dust boundaries |
| Tracers | 5 mineral-dust bins (advection, diffusion, sedimentation, wet + dry deposition) |
| Solver | explicit :dst_koren_rk3, dt = 3600 s, CFL = 0.7 |
| Satellite reference | GRASP/POLDER Insoluble_Volume_Concentration_C (0.1° daily) |
| TARSA comparison quantity | summed dust-column volume (paper diagnostic: DU001–DU004) |
The five dust bins are defined by dry particle radius and material density, configured through simulation.dust_radius_um and simulation.dust_density_kg_m3:
| Bin | 1 | 2 | 3 | 4 | 5 |
|---|---|---|---|---|---|
| Representative radius (µm) | 0.73 | 1.4 | 2.4 | 4.5 | 8.0 |
| Density (kg m⁻³) | 2500 | 2650 | 2650 | 2650 | 2650 |
Before you run
Unlike the tutorial, this case does not run out of the box: it reads a prepared input bundle (ERA5, MERRA-2 emissions, CAMS dust, GRASP/POLDER observations). The bundle is fetched by 00_download_data.sh and needs no Copernicus/NASA Earthdata credentials — but the bundle URL must be set first. See examples/FENNEC_june2011/DATA_MANIFEST.md for the file list, sources, and licensing, and the case README.md for the full stage layout.
Pipeline
The case runs as four numbered stages. Run the scripts inside each stage folder in their numbered order, from examples/FENNEC_june2011/.
| Stage | Item | Purpose |
|---|---|---|
| 0 | 00_download_data.sh | Fetch and unpack the prepared input bundle into data/ and polder/ |
| 1 | 01_observations/ | GRASP/POLDER daily maps and digitized profile assets |
| 2 | 02_transport/ | TARSA transport run and column-volume diagnostics |
| 3 | 03_visualization/ | TARSA / MERRA-2 / CAMS / POLDER comparisons and plots |
The primary configuration is the large clean spin-up run config_runF_large_clean_spinup.yml: zero initial condition, homogeneous Neumann lateral dust boundaries, MERRA-2 emissions as the only dust source, and sedimentation, wet deposition, and dry deposition enabled. This is the configuration used for the manuscript's primary FENNEC result. An older MERRA-2-BC/IC configuration (config.yml, which imposes MERRA-2 3-D dust fields as initial and lateral boundary conditions) is retained only as a reference sensitivity.
Run the transport and comparison
# Fetch the prepared input bundle once:
bash 00_download_data.sh

# TARSA forward run for the primary clean spin-up configuration:
julia --project=../.. 02_transport/01_run_simulation.jl config_runF_large_clean_spinup.yml

# Column-integrate the dust bins to the comparison quantity:
python 02_transport/02_compute_tarsa_column_volume.py config_runF_large_clean_spinup.yml

# Collocate and compare against GRASP/POLDER (evaluation starts 16 June):
python 03_visualization/02_post_tarsaVsgrasp_polder.py config_runF_large_clean_spinup.yml \
    --start-date 2011-06-16
Main inputs and outputs
- Configuration:
config_runF_large_clean_spinup.yml - TARSA simulation output:
out/fennec_june2011_dust_runF_large_clean_spinup_power_law.nc - TARSA column-volume diagnostics:
out/..._column_volume.nc - MERRA-2 column-volume reference:
out/merra2_dust_column_volume.nc - Scatter and map products:
out/
Results
Surface dust animation
The near-surface dust plume is the most direct view of what TARSA transports. This animation shows the model surface (1000 hPa level) total dust mass concentration — the sum of the five dust bins — over the full 12–25 June 2011 window (the first four days are spin-up):
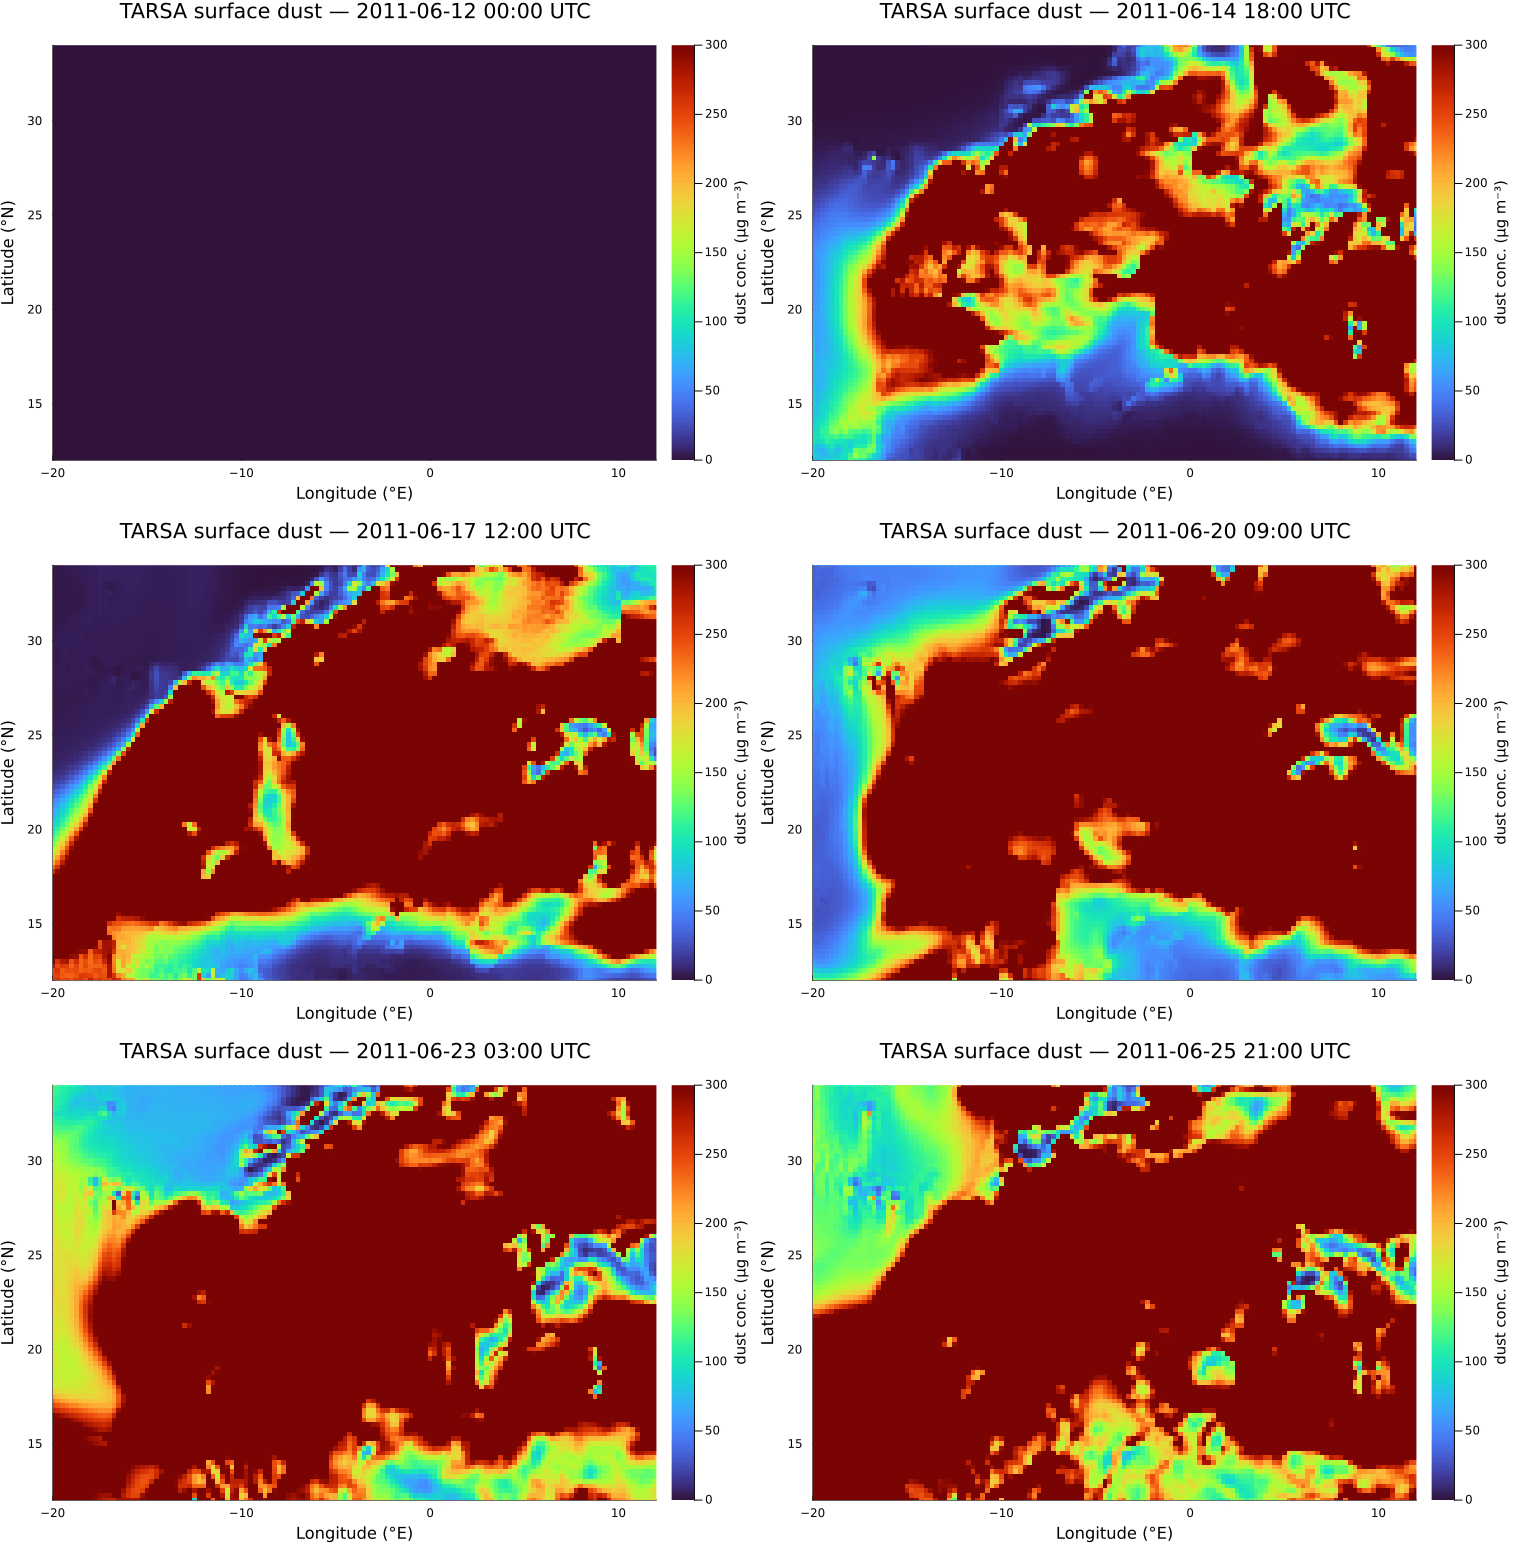
Dust is lofted over the Saharan source regions and advected across North Africa by the ERA5 winds, with the near-source concentrations reaching several hundred µg m⁻³. Reproduce it from a completed run with:
julia --project=../.. 03_visualization/09_animate_surface_dust.jl \
    out/fennec_june2011_dust_runF_large_clean_spinup_power_law.nc \
    --out out/fennec_surface_dust.gif --stride 3 --vmax 300
The script reads the dust_total_concentration field from the TARSA output, takes the surface level, and renders every third hourly frame.
The satellite reference
The observational reference is the GRASP/POLDER Level-3 coarse-insoluble column volume concentration (Insoluble_Volume_Concentration_C), used here as a dust-dominated column proxy — not as an independent ground-truth dust measurement, since the product is itself a retrieved aerosol-component field.
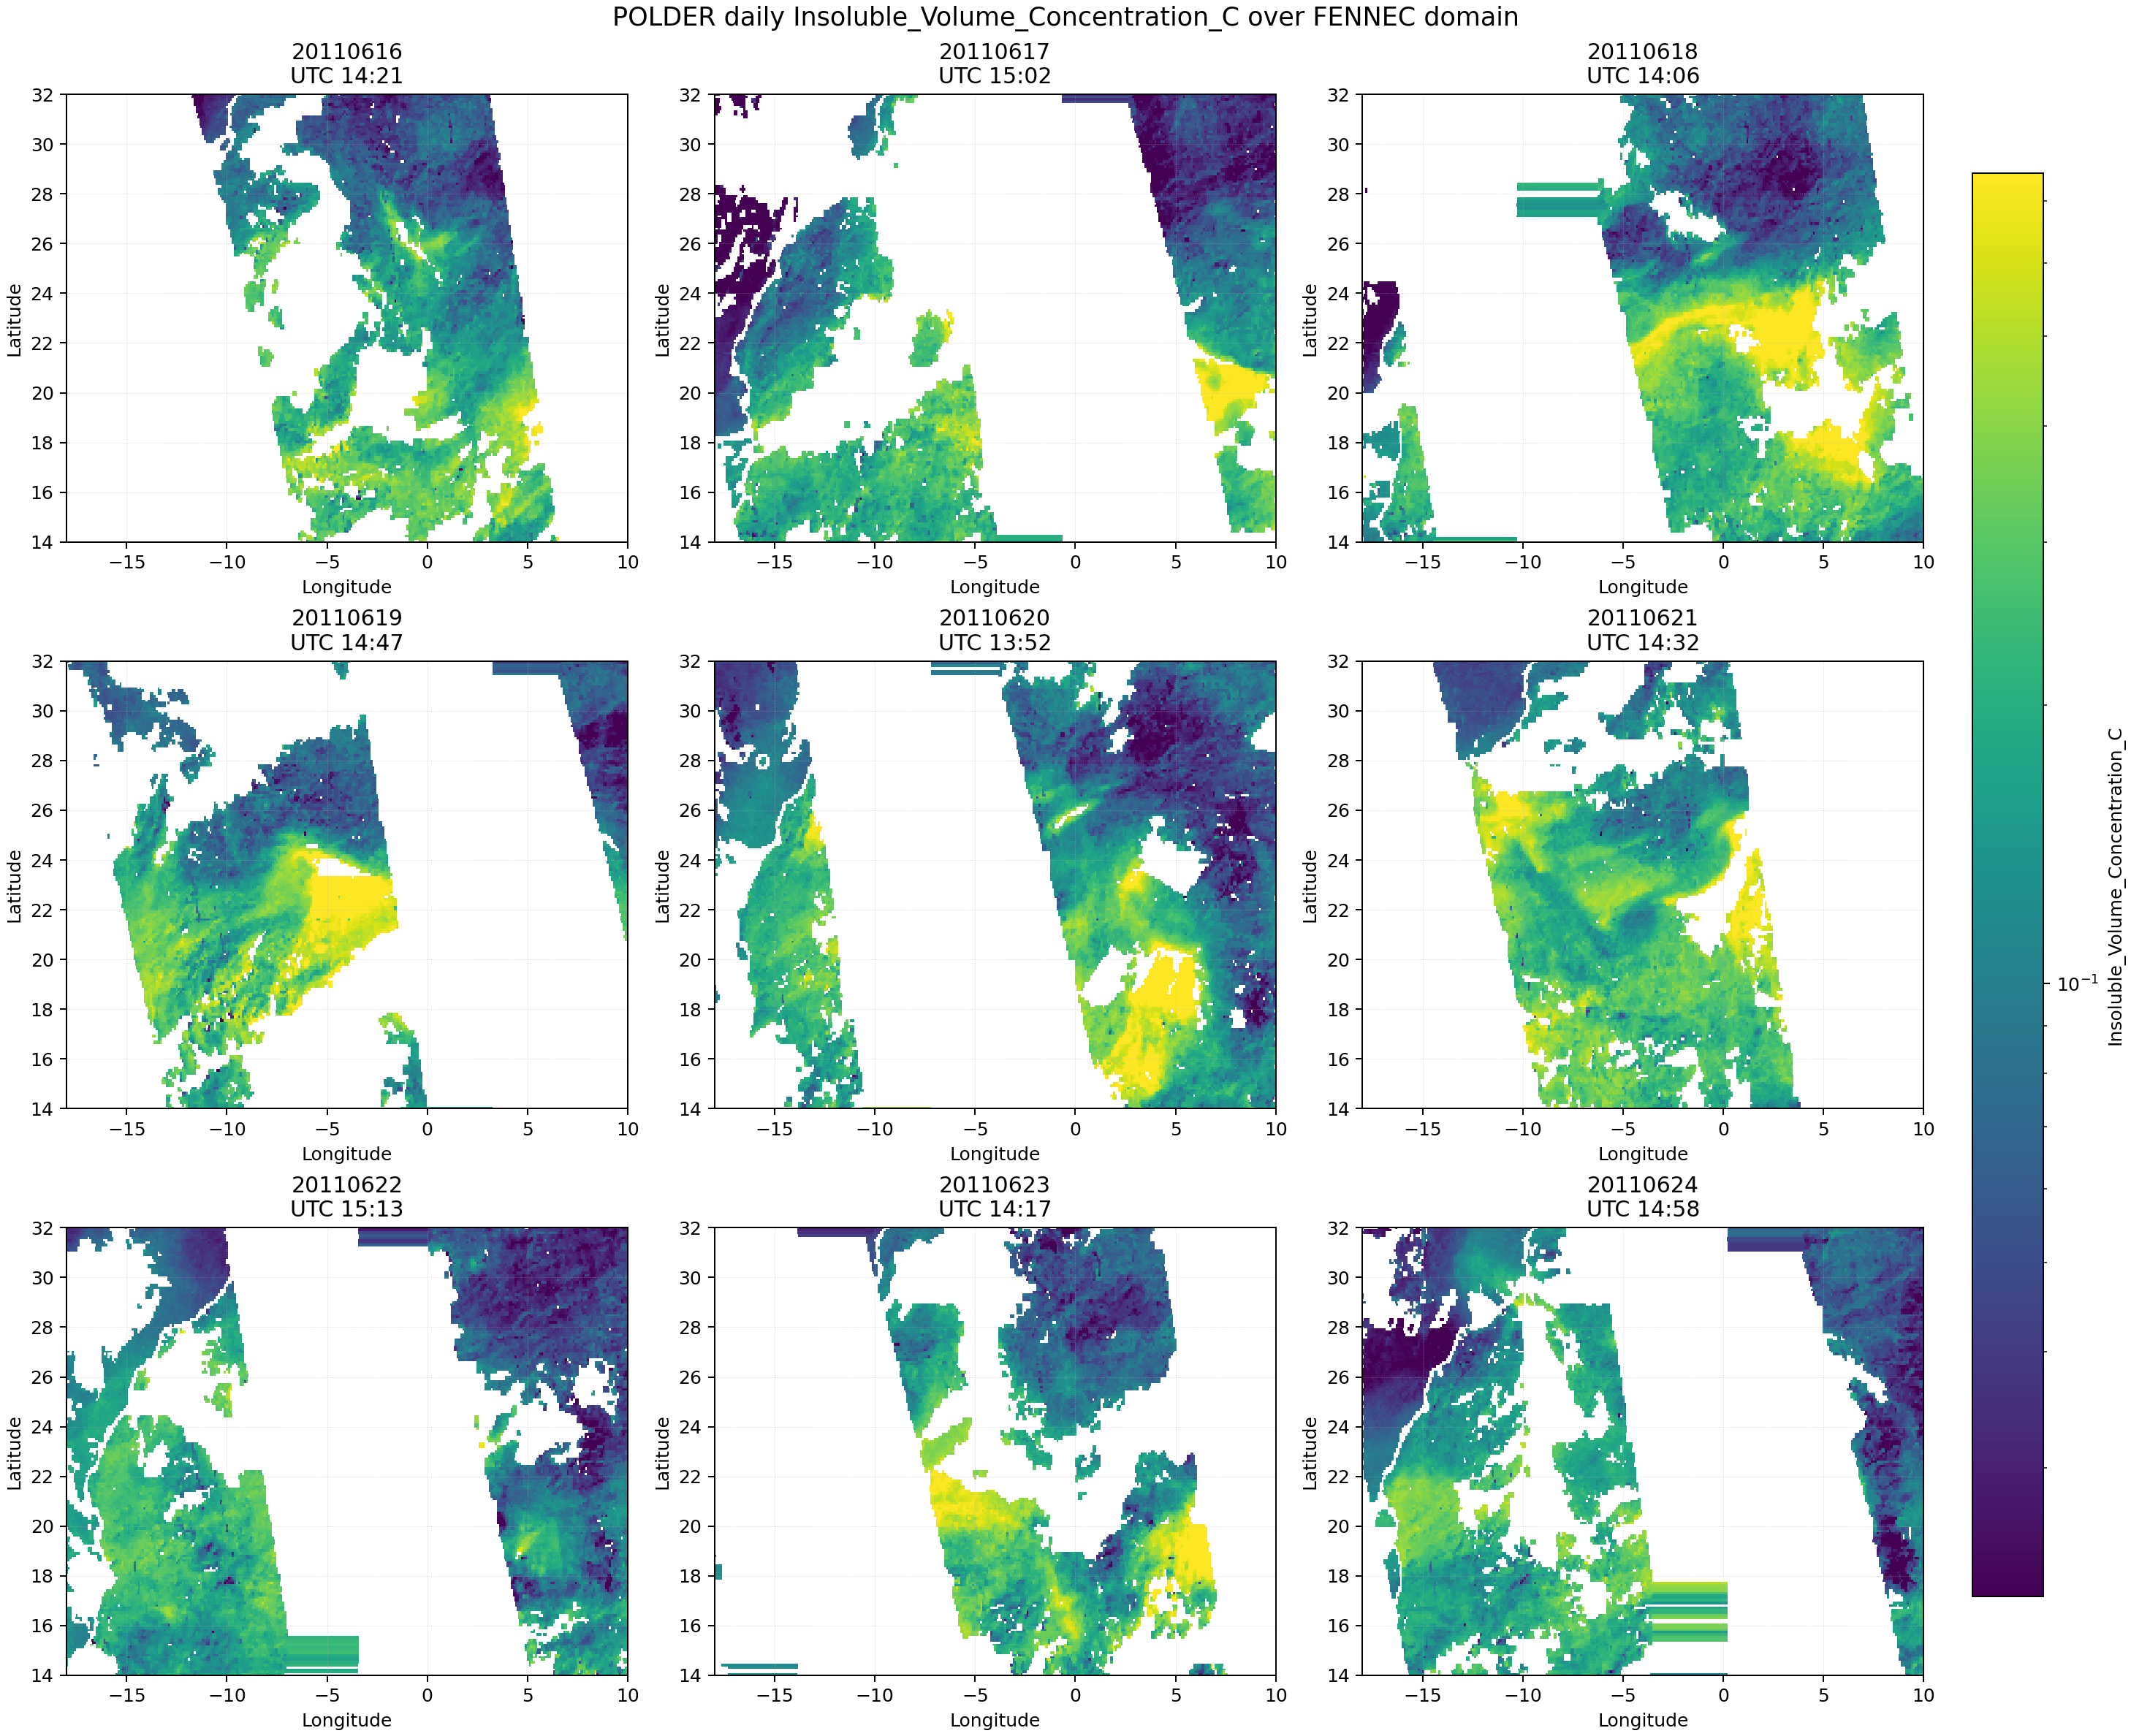
The retrieval shows persistent, spatially extensive Saharan dust loading with strong day-to-day variability in plume extent and intensity.
Collocated scatter comparison
The pointwise comparison is made in the same collocated observation space for two very different levels of constraint: the MERRA-2 dust reanalysis product (assimilative) and the free TARSA forward run (no aerosol observations assimilated into the dust state).
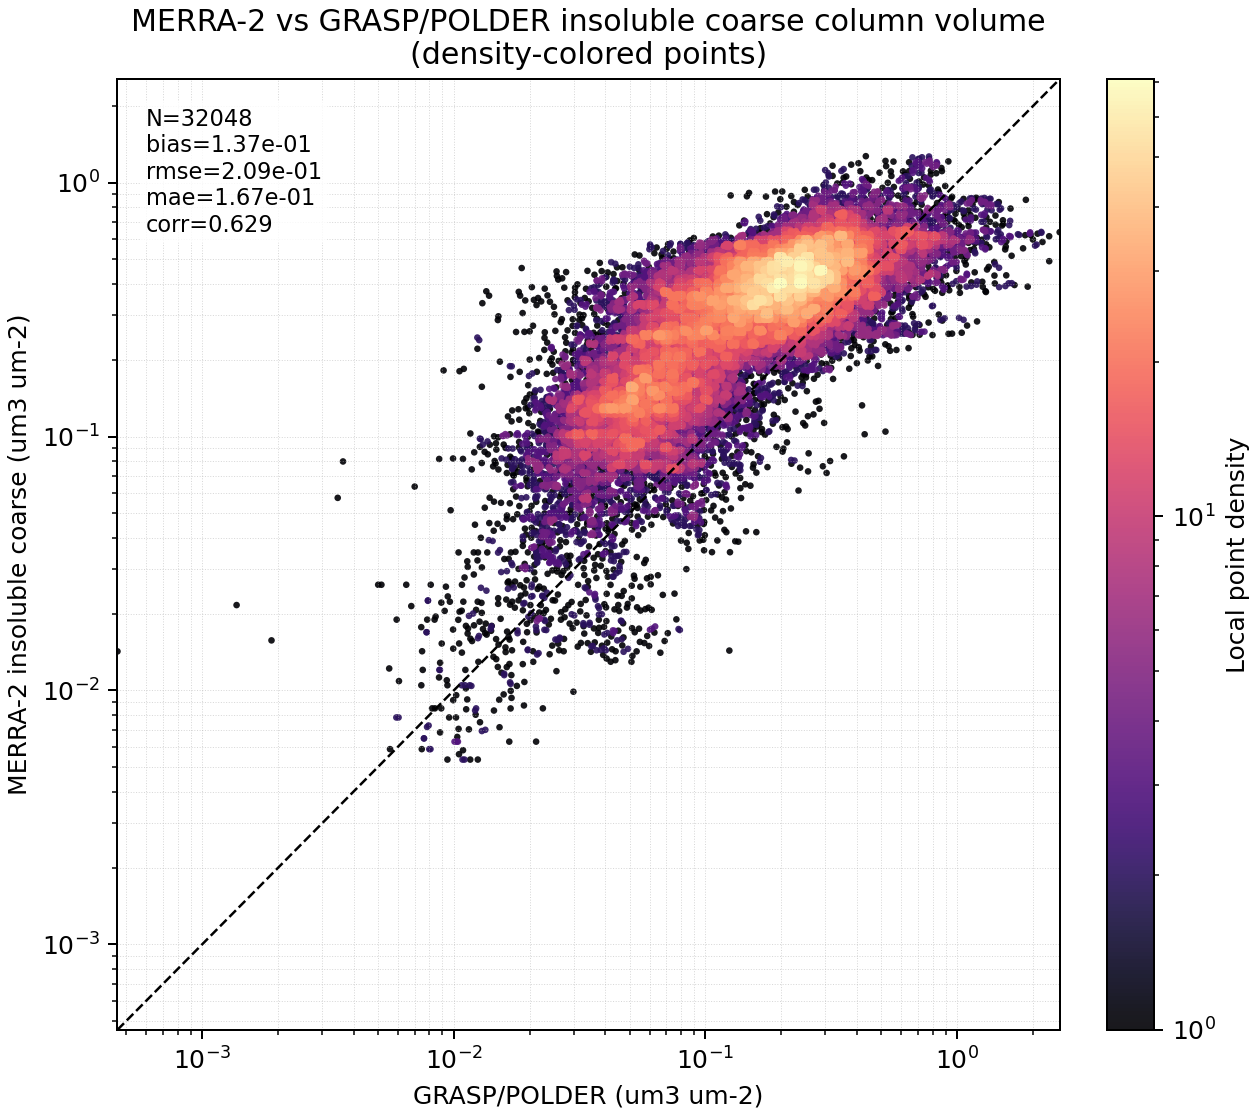
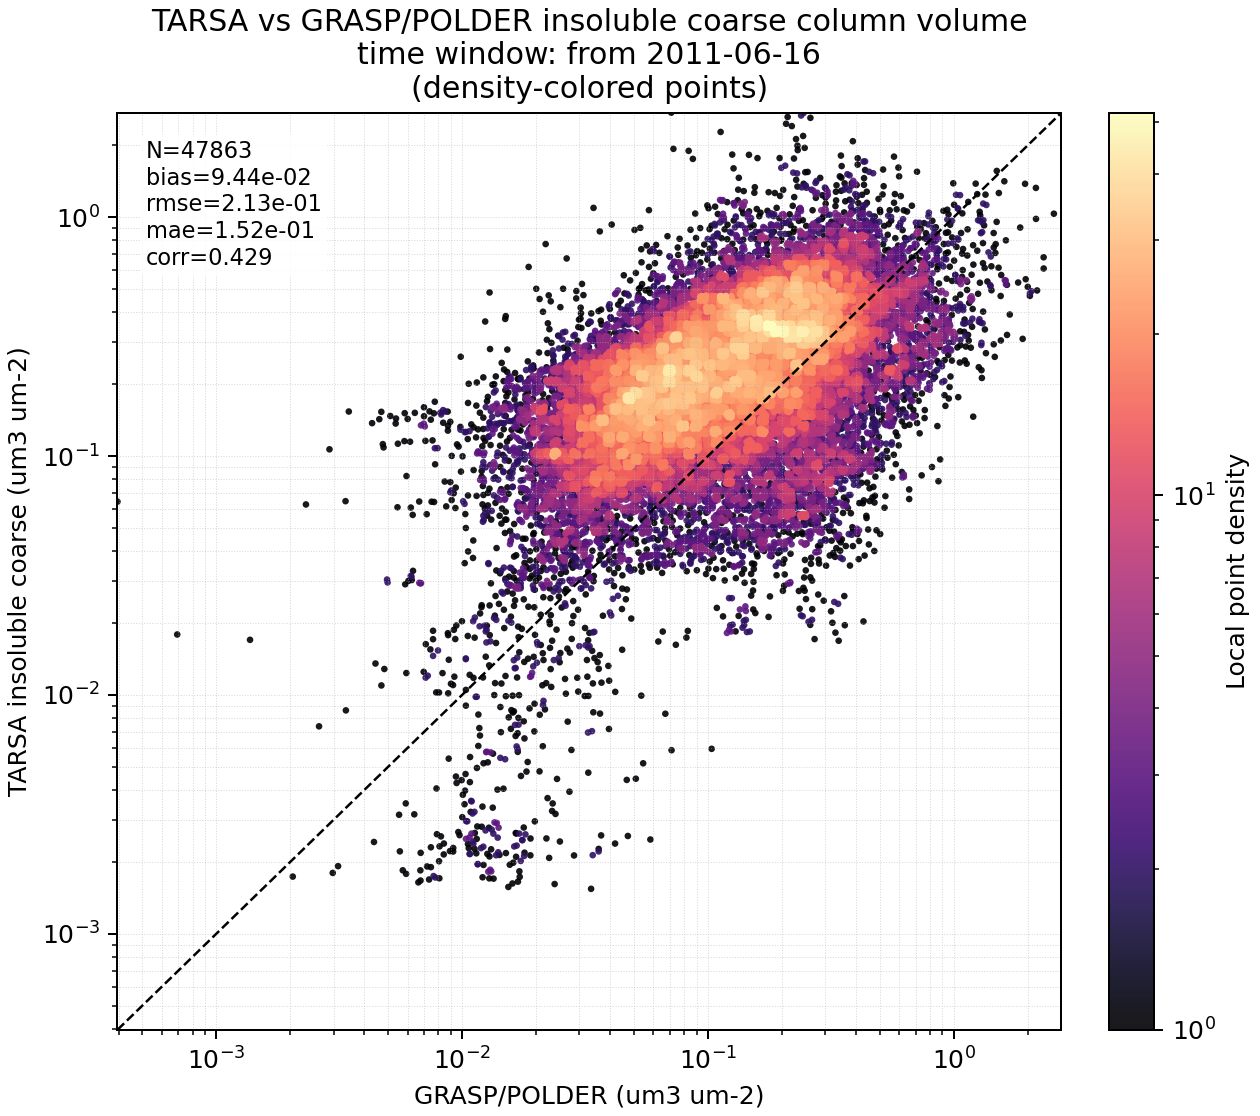
| Model | N | bias | RMSE | MAE | r |
|---|---|---|---|---|---|
| TARSA spin-up Neumann | 47 863 | 0.094 | 0.213 | 0.152 | 0.429 |
| MERRA-2 assimilative product | 32 048 | 0.137 | 0.209 | 0.167 | 0.629 |
This is deliberately not an equal-constraint intercomparison: MERRA-2 is an assimilative aerosol reanalysis, whereas TARSA is a free dust forecast relative to the retrievals used for evaluation. The assimilative product retains the stronger pointwise association, as expected, while the free TARSA run still captures a positive spatial association and the correct order of magnitude, with some overestimation of coarse dust.
Daily map comparison
Daily maps are formed as POLDER-observation-weighted means so that TARSA and the MERRA-2 reference are sampled consistently with the satellite coverage.
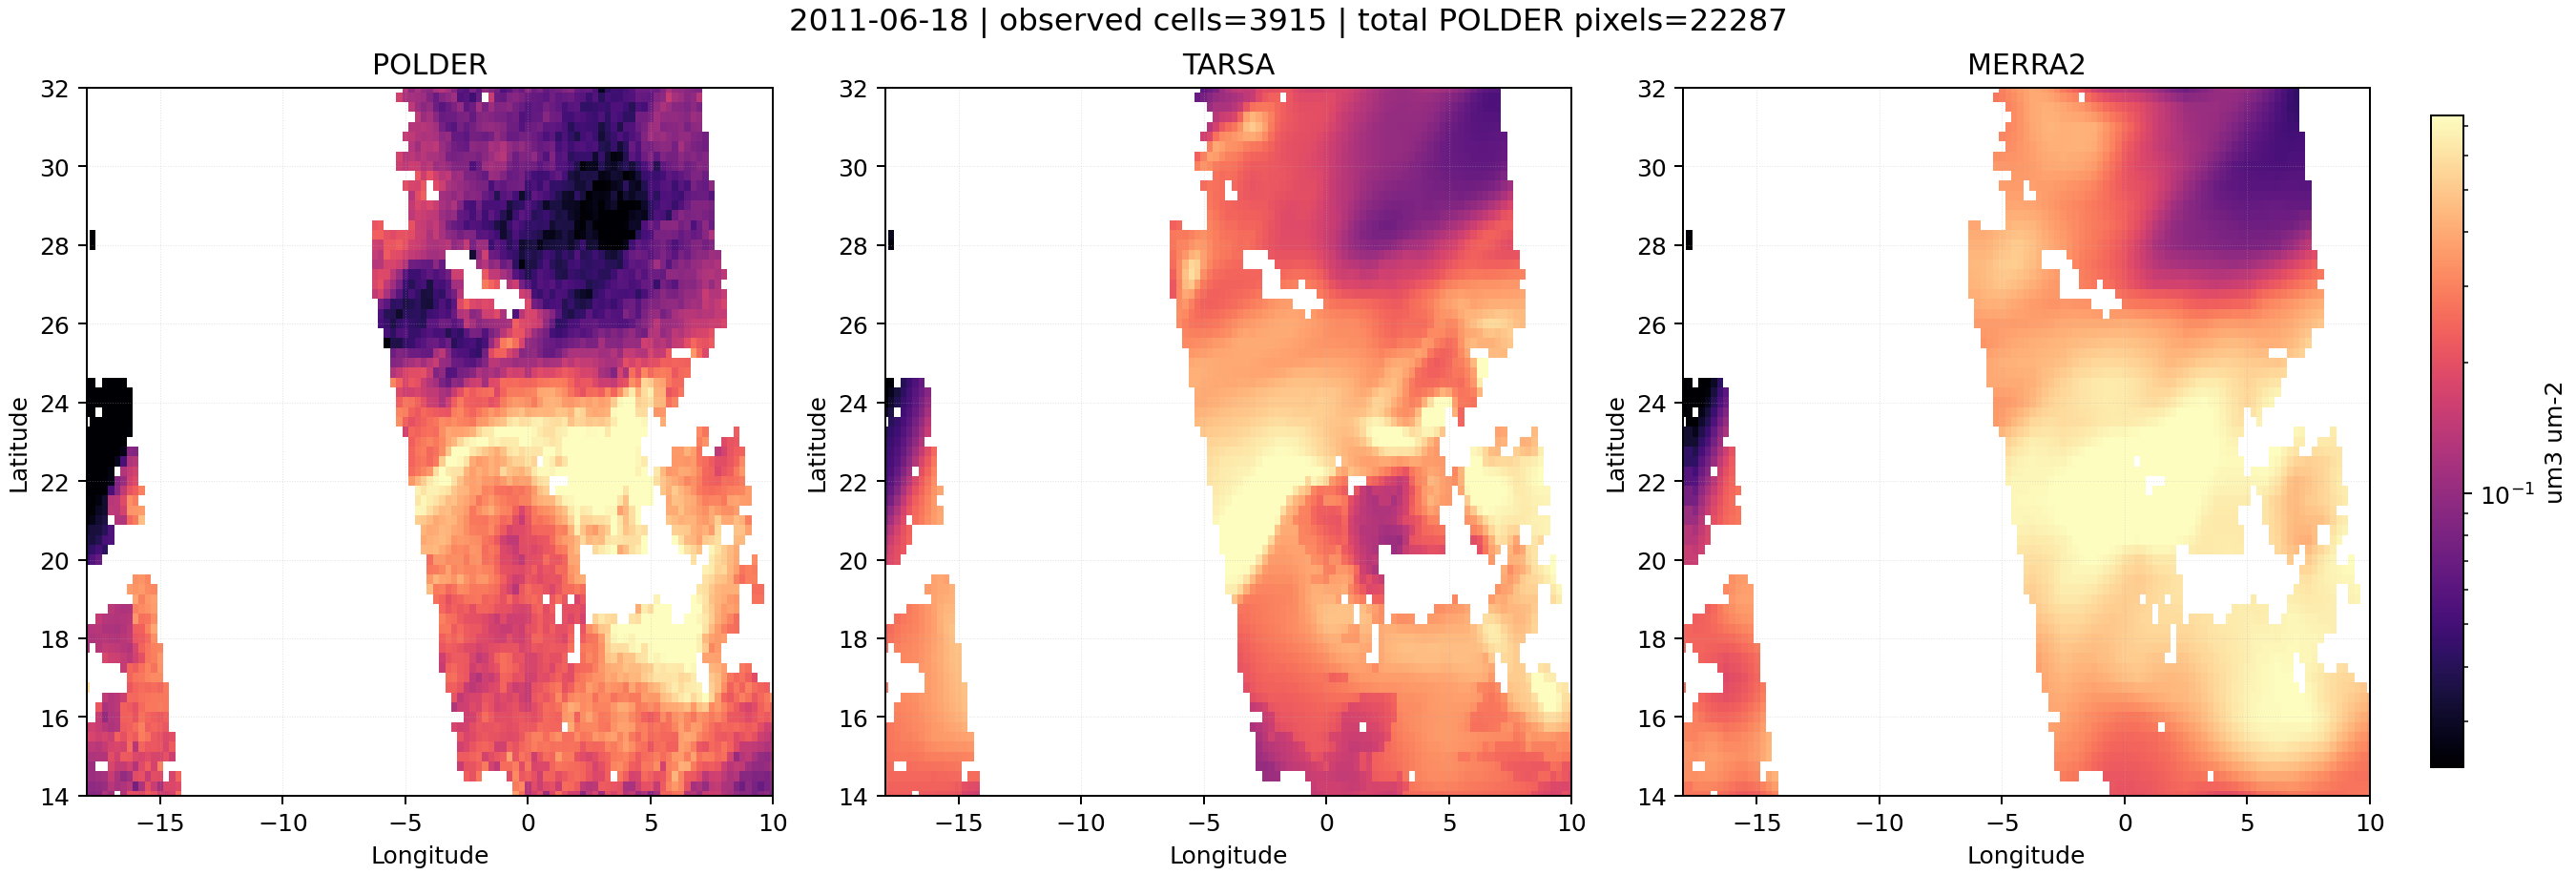
TARSA reproduces the broad regional dust distribution seen in the retrieval, while differences remain in local maxima and plume sharpness. Because this run uses homogeneous Neumann lateral dust boundaries after spin-up, the agreement is not inherited from imposed MERRA-2 lateral dust concentrations — it is the response of the TARSA transport, removal, column-integration, and collocation workflow to ERA5 meteorology and prescribed MERRA-2 emissions.
Process-sensitivity diagnostic
A four-run diagnostic under the same spin-up and Neumann-boundary setup isolates the role of the removal parameterizations. Runs B–E toggle dry and wet deposition:
| Run | dry dep. | wet dep. | bias | RMSE | MAE | r |
|---|---|---|---|---|---|---|
| D | no | no | 0.382 | 0.770 | 0.406 | 0.371 |
| C | no | yes | 0.368 | 0.757 | 0.393 | 0.368 |
| E | yes | no | 0.100 | 0.216 | 0.155 | 0.433 |
| B | yes | yes | 0.094 | 0.213 | 0.152 | 0.429 |
Dry deposition provides the dominant reduction in positive dust-column bias: adding it (Run E) cuts the bias from 0.382 to 0.100 and the RMSE from 0.770 to 0.216. Adding wet deposition on top (Run B) gives the lowest bias, RMSE, and MAE. Reproduce this table with:
julia --project=../.. 02_transport/01_run_simulation.jl config_runD_clean_no_drywet.yml
julia --project=../.. 02_transport/01_run_simulation.jl config_runC_clean_no_dry.yml
julia --project=../.. 02_transport/01_run_simulation.jl config_runE_clean_dry_no_wet.yml
julia --project=../.. 02_transport/01_run_simulation.jl config_runB_clean.yml
# ... compute_tarsa_column_volume.py for each, then:
python 03_visualization/08_tabulate_tarsa_vs_grasp_polder_runs.py
How to interpret this case
- Treat it as a test of the aerosol-process extension and observation-space workflow: emission specification, transport, removal, column integration, satellite collocation, and comparison all work together in one reproducible chain.
- The dust source term is prescribed from MERRA-2, so this is not an independent evaluation of dust emissions.
- The primary clean spin-up run is deliberately less constrained than the older MERRA-2-BC/IC setup: the evolving dust column is not prescribed at the initial time or lateral boundaries, so agreement is not inherited from external dust fields.
- Homogeneous Neumann lateral boundaries can under-represent externally advected dust entering the domain, so interpretation should focus on the post-spin-up evaluation window and, where possible, on regions not dominated by boundary inflow.