CAMS replay consistency experiment
Purpose
This case compares TARSA against CAMS reanalysis fields in a tightly constrained replay setup. It is a consistency test, not an independent validation of atmospheric composition.
The reason is central to the interpretation: TARSA is initialized from CAMS 3-D tracer fields, uses CAMS as time-varying lateral and lower-boundary concentrations, and applies no additional emissions inside the domain. The question is therefore not whether TARSA can independently recover the observed atmosphere, but whether it can preserve realistic 3-D tracer structure over a two- to three-day time scale under ERA5 forcing while applying its own transport and removal operators.
This replay case uses TARSA's robust replay solver:
- Advection: first-order upwind
- Time integration: backward Euler
- Vertical diffusion: implicit, assembled into the monolithic solve
- Configuration: fully implicit replay mode with
dt = 3600 s
Configuration
The setup is a regional CAMS replay on an approximately 80 x 80 x 25 grid. The checked-in repository script implements the same idea on the ERA5 grid and currently prepares:
- region:
30-45 N,-10-5 E - period:
2008-07-07to2008-07-10 - meteorology: ERA5
- composition input: CAMS EAC4 fields regridded onto the ERA5 grid
- internal emissions: none
Tracer treatment is:
- CO: inert transported tracer
- Dust bins 1-2, BC, OM, sea-salt bin 1: aerosol tracers with transport, sedimentation, and wet deposition
- Dry deposition: disabled in this replay configuration so near-surface removal is not double-counted when lower-boundary concentrations are prescribed from CAMS
The repository workflow is implemented in:
validation/CAMS/validation_cams_7species.jlvalidation/CAMS/plot_cams_vs_tarsa.py
The Julia script prepares the ERA5 inputs, reads an externally regridded CAMS input file, computes helper fields such as dz, rho, cloud water, and precipitation diagnostics, runs the implicit replay for each tracer, and writes TARSA outputs back into the CAMS-aligned NetCDF file used by the plotting script.
Results
The figures below summarize the main CAMS diagnostics.
Vertical-profile comparisons
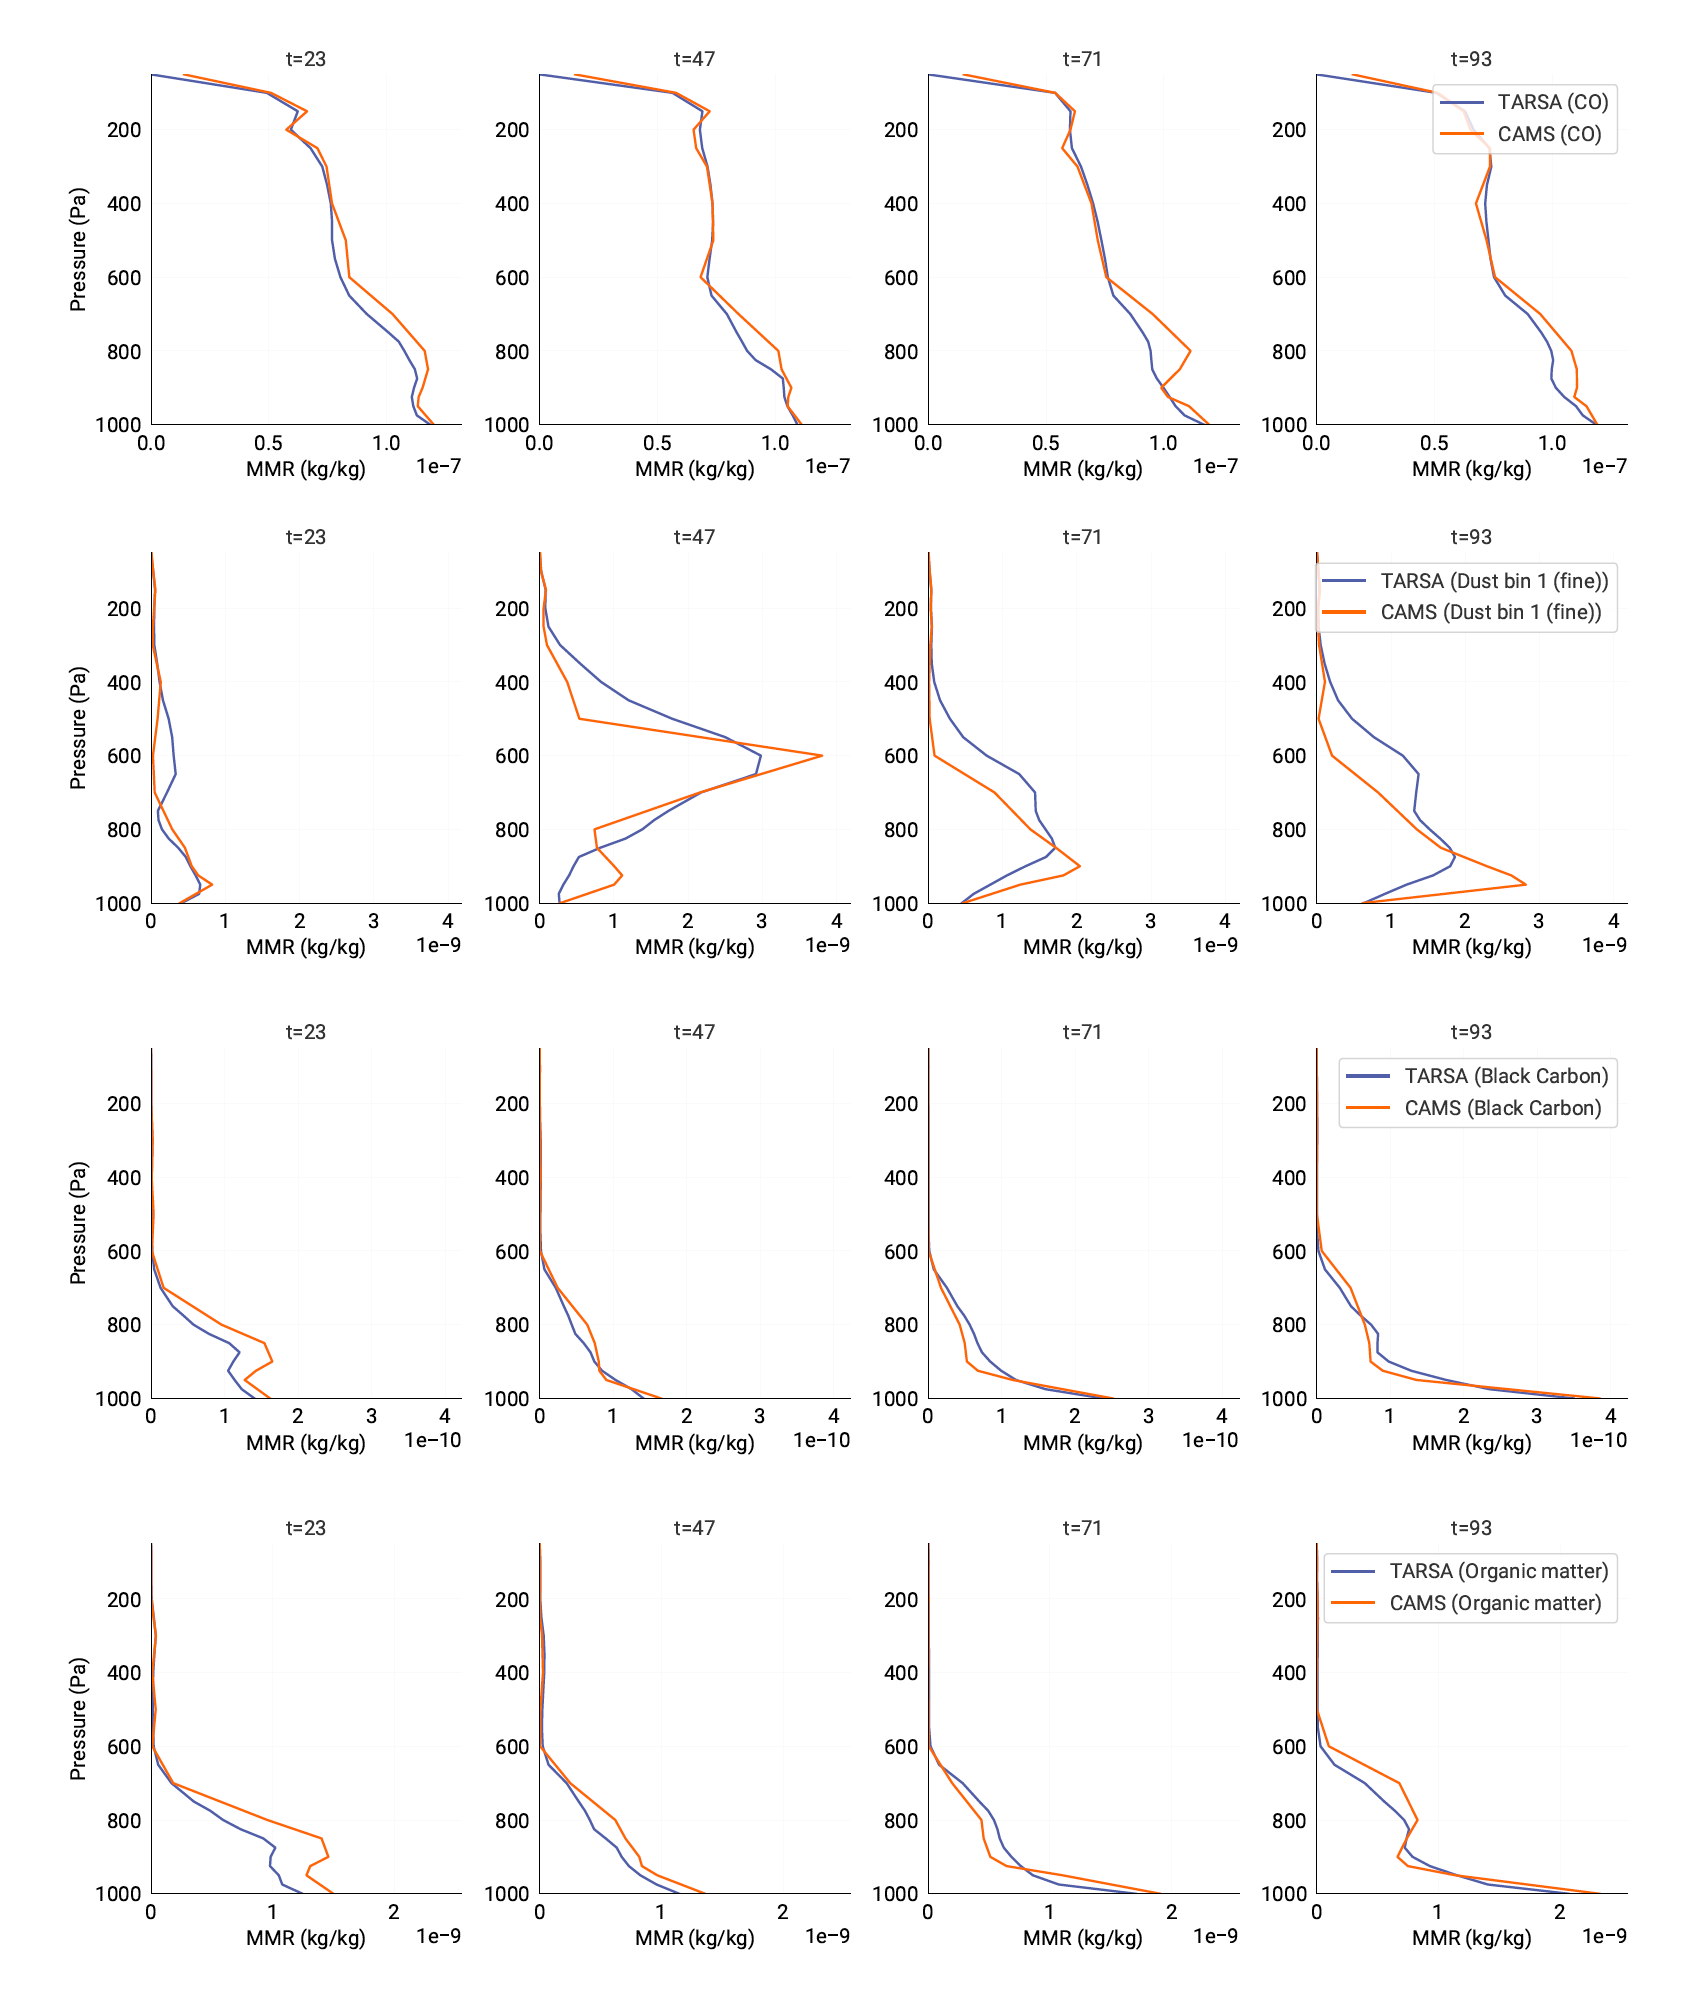
This figure compares CAMS and TARSA vertical mixing-ratio profiles for four representative species: CO, fine dust, black carbon, and organic matter. The rows correspond to those four species, and each column is a later replay output time at the same sampled grid point.
The interpretation is straightforward:
- CO agrees closely through much of the troposphere, showing that TARSA preserves the large-scale vertical structure of a long-lived inert tracer over the replay window.
- Aerosol differences are larger near the surface and in the upper troposphere.
- Those aerosol mismatches are consistent with the simplified TARSA aerosol physics relative to CAMS, especially missing ageing and partitioning processes, together with forcing differences between CAMS and ERA5.
Gridpoint scatter diagnostics
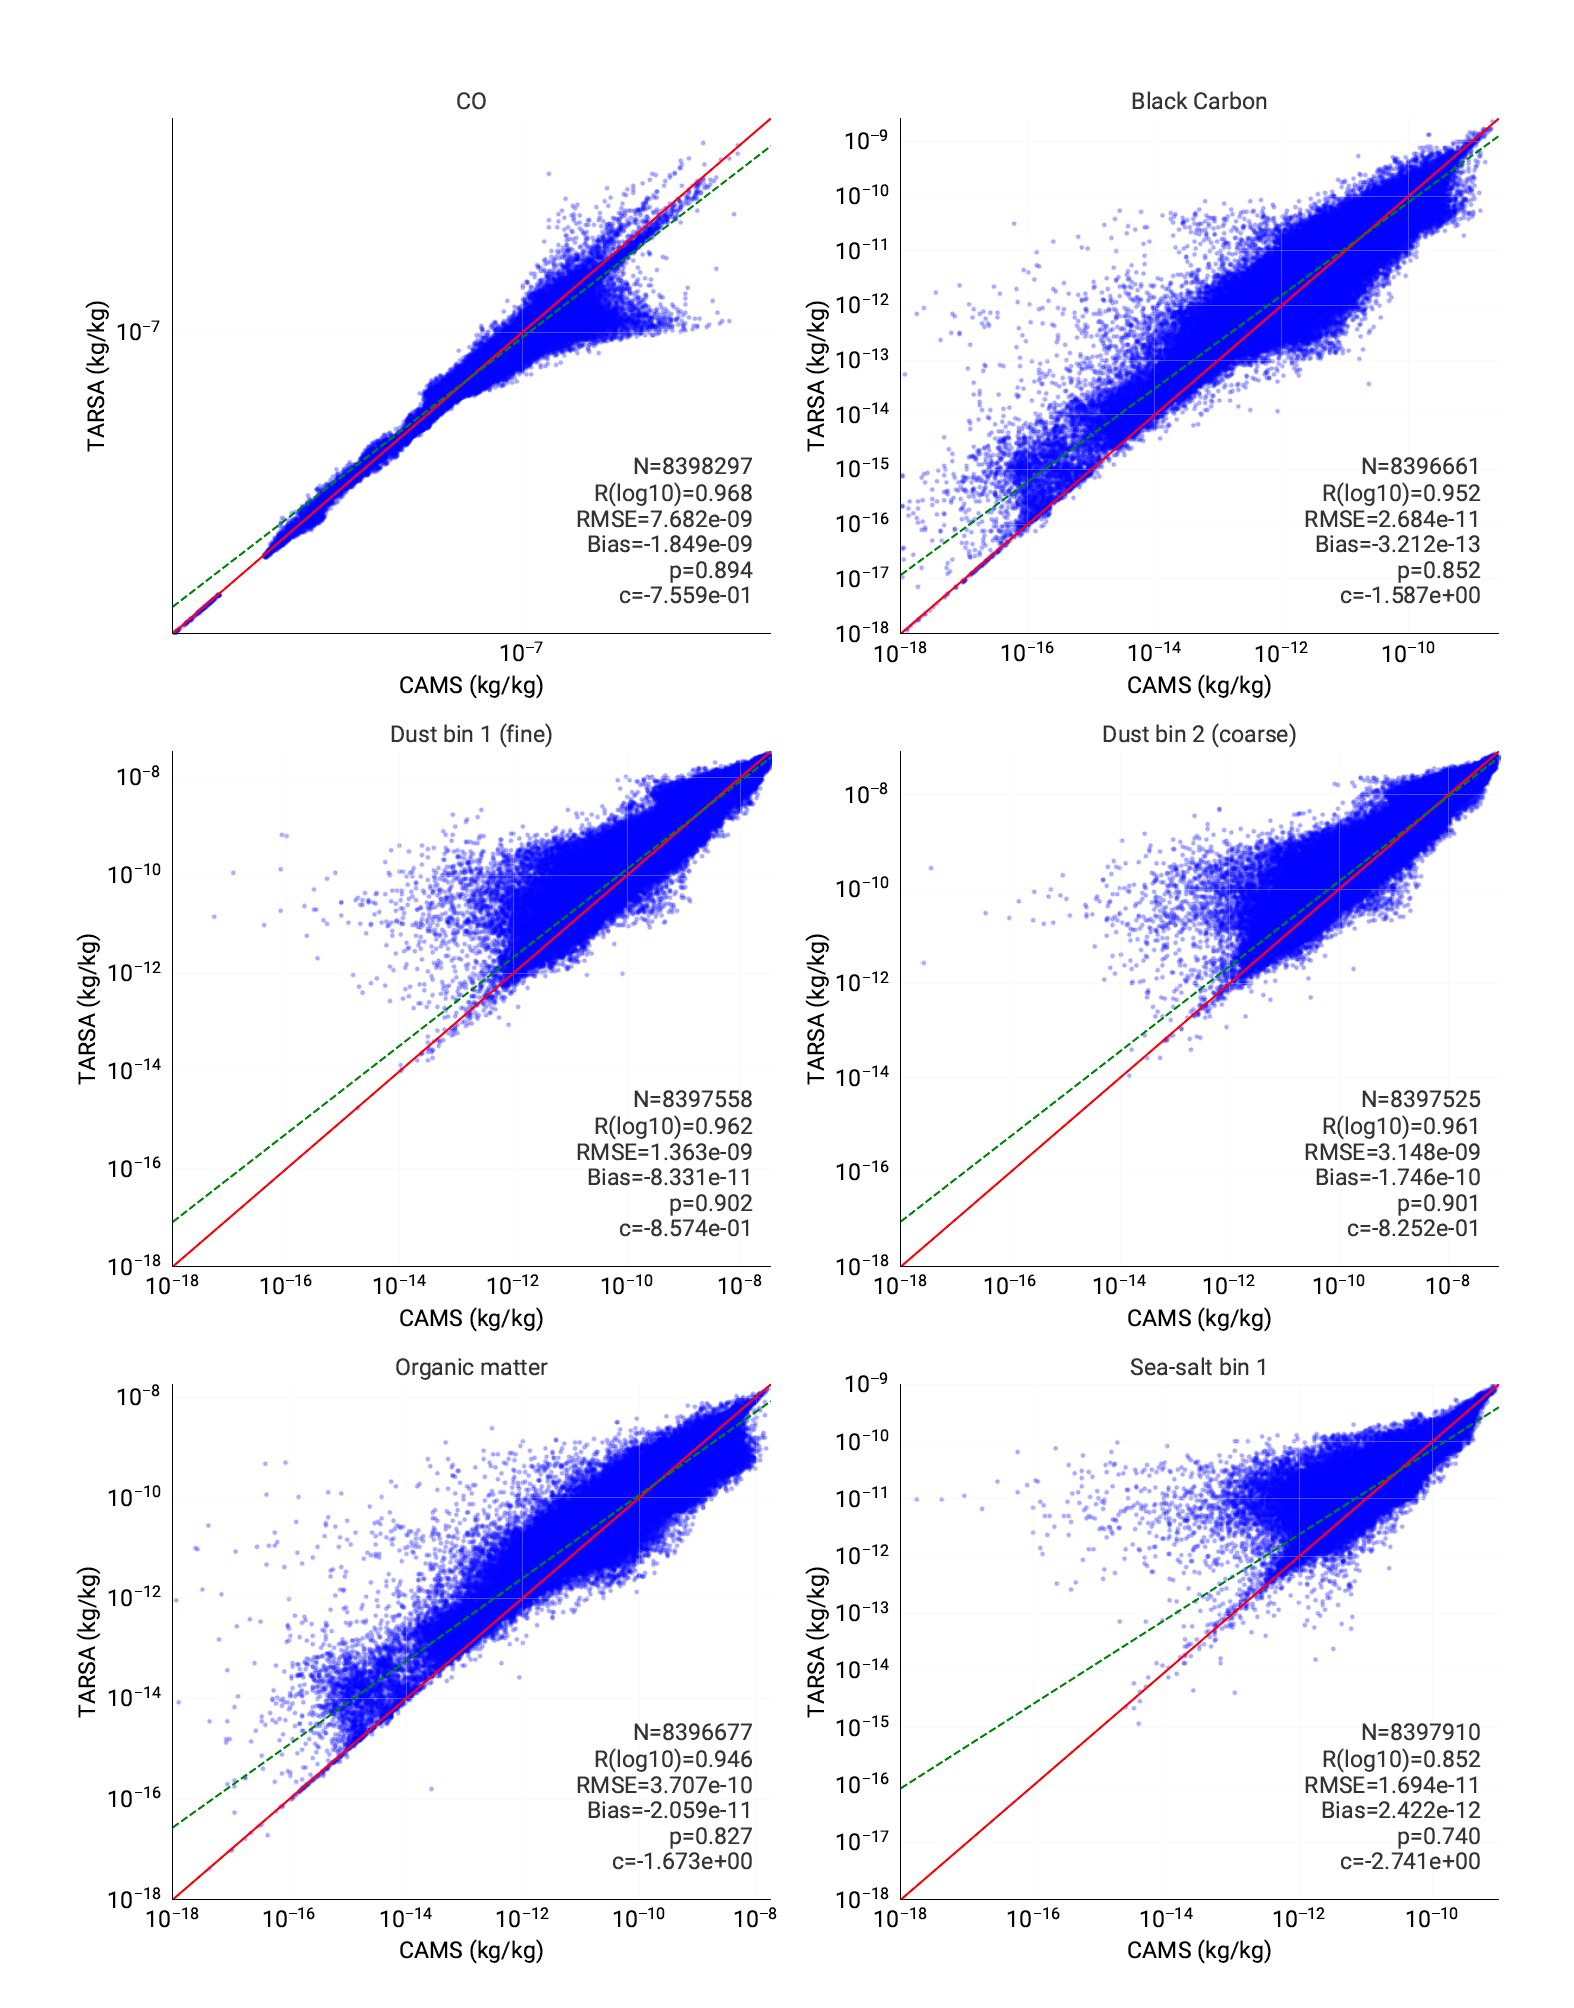
This scatter summary compares TARSA concentrations against CAMS for six species: CO, black carbon, fine dust, coarse dust, organic matter, and sea-salt bin 1. The panels are ordered exactly that way from top left to bottom right, giving a compact view of which species are replayed most consistently.
The main reading of this figure is:
- CO and both dust bins stay close to the
1:1relation over a wide dynamic range. - Black carbon and organic matter show visibly more spread in linear space, with the largest errors concentrated in the high-concentration tail.
- Sea-salt bin 1 behaves differently: linear-space agreement is strong, but log-space agreement is weaker, consistent with sensitivity to near-surface winds and small-scale variability.
Summary metrics
The following species-wise CAMS comparison statistics summarize the replay performance.
| Species | n linear | r linear | R^2 linear | n log | r log | R^2 log | Notes |
|---|---|---|---|---|---|---|---|
| CO | 8744350 | 0.9488 | 0.9002 | 8398297 | 0.9630 | 0.9274 | inert tracer; replay consistency only |
| Black carbon | 8744234 | 0.8635 | 0.7457 | 8396661 | 0.9443 | 0.8917 | no ageing / partitioning |
| Dust bin 1 (fine) | 8744270 | 0.9492 | 0.9009 | 8397558 | 0.9579 | 0.9175 | strongest aerosol agreement |
| Dust bin 2 (coarse) | 8744297 | 0.9474 | 0.8976 | 8397525 | 0.9574 | 0.9165 | slightly broader spread than dust bin 1 |
| Organic matter | 8744211 | 0.8130 | 0.6609 | 8396677 | 0.9364 | 0.8768 | no secondary formation |
| Sea-salt bin 1 | 8744307 | 0.9451 | 0.8933 | 8397910 | 0.8397 | 0.7050 | sensitive to surface-wind variability |
These numbers support the same conclusion as the figures:
- long-lived inert structure is preserved very well
- dust replay is also strong
- carbonaceous aerosol skill is clearly weaker in linear space but improves strongly in log space
- remaining mismatches are more consistent with missing aerosol physics and forcing differences than with a failure of the transport core itself
Overall, this makes the CAMS case operationally useful as a replay/regression benchmark, but its scientific evidential weight remains intentionally lower than ETEX-1.
Why this case matters
- exercises TARSA's implicit replay configuration under strongly constrained, time-varying boundary conditions
- checks whether realistic 3-D tracer structure is preserved over a short regional forecast window
- tests aerosol branches that are absent from the inert-tracer ETEX and Gaussian cases
- provides a practical regression case for preprocessing, wet deposition, and sedimentation workflows
How to run
Scripts
Folder: validation/CAMS
Main scripts:
validation/CAMS/validation_cams_7species.jlvalidation/CAMS/plot_cams_vs_tarsa.py
validation_cams_7species.jl
- prepares the ERA5 inputs and reads an externally regridded CAMS file for the replay window
- computes
dz,rho, precipitation/cloud diagnostics, and aerosol sink terms - runs the implicit TARSA replay for multiple species with CAMS-derived initial and boundary conditions
- writes TARSA output variables back into the CAMS-aligned NetCDF file
plot_cams_vs_tarsa.py
- reads the combined CAMS/TARSA NetCDF product
- builds representative vertical-profile figures at one sampled location
- computes multi-species scatter diagnostics and summary statistics
Representative outputs are written under validation/CAMS/out/.
Run
The built-in CAMS download/regridding path is currently disabled because the old xESMF backend was removed. To re-run this replay, first prepare a CAMS NetCDF file already regridded onto the ERA5/TARSA grid used by the script, then pass it through TARSA_CAMS_LEVELS_FILE:
TARSA_CAMS_LEVELS_FILE=/path/to/cams_on_tarsa_grid.nc julia --project=. validation/CAMS/validation_cams_7species.jl
python validation/CAMS/plot_cams_vs_tarsa.py