CAPTEX-1 independent field comparison
Purpose
This repository case reproduces the CAPTEX-1 PMCH release over eastern North America and provides an additional independent field-release comparison outside the European ETEX setting (Ferber et al., 1986).
Unlike ETEX-1, CAPTEX is not the main field-evaluation case in this documentation set. It remains useful because it exercises the same core transport logic against interval-averaged station observations under a different geography, release geometry, and observation-processing workflow.
Configuration
The checked-in scripts currently use:
- tracer: PMCH
- release site: Dayton area, Ohio (
39.80 N,-84.05) - release start:
1983-09-18 17:00 UTC - release duration:
3 h - total released mass:
208000 g - domain:
38-48 N,-85 to -70 - meteorology: ERA5
- CAMS download: disabled
The base script injects the release into the lowest model level using a mass-conserving bilinear four-cell split around the source location. Initial and boundary concentrations are set to zero, and the current baseline time step in the script is 1800 s.
Two repository driver variants are provided:
validation_captex1.jl: base-grid CAPTEX run using ERA5 fields directlyvalidation_captex1_highres.jl: refined-grid explicit run with 2x horizontal and vertical refinement
Results
The companion plotting script evaluates TARSA against the CAPTEX station records using several observation-space diagnostics:
- representative station time series
- station-wise maximum concentration
- station-wise dosage
- station-wise arrival time
- pointwise and threshold-based agreement summaries
The observation handling is explicit in validation_captex1_plot.py:
- CAPTEX observations are treated as interval averages
- concentrations are converted from
pg m^-3tong m^-3 - observation and model time offsets can be adjusted at the top of the script
- model values over the observation interval can be aggregated with a mean or maximum statistic
- arrival time and dosage are computed from thresholded station time series
For the current refined-grid dt = 1800 s configuration, the pointwise interval-average comparison uses 395 valid station-interval pairs and gives:
- correlation
R = 0.719(R^2 = 0.517) - bias
0.218 ng m^-3 - RMSE
1.002 ng m^-3 - non-trivial agreement-based Rank
2.134
Average-rank comparison
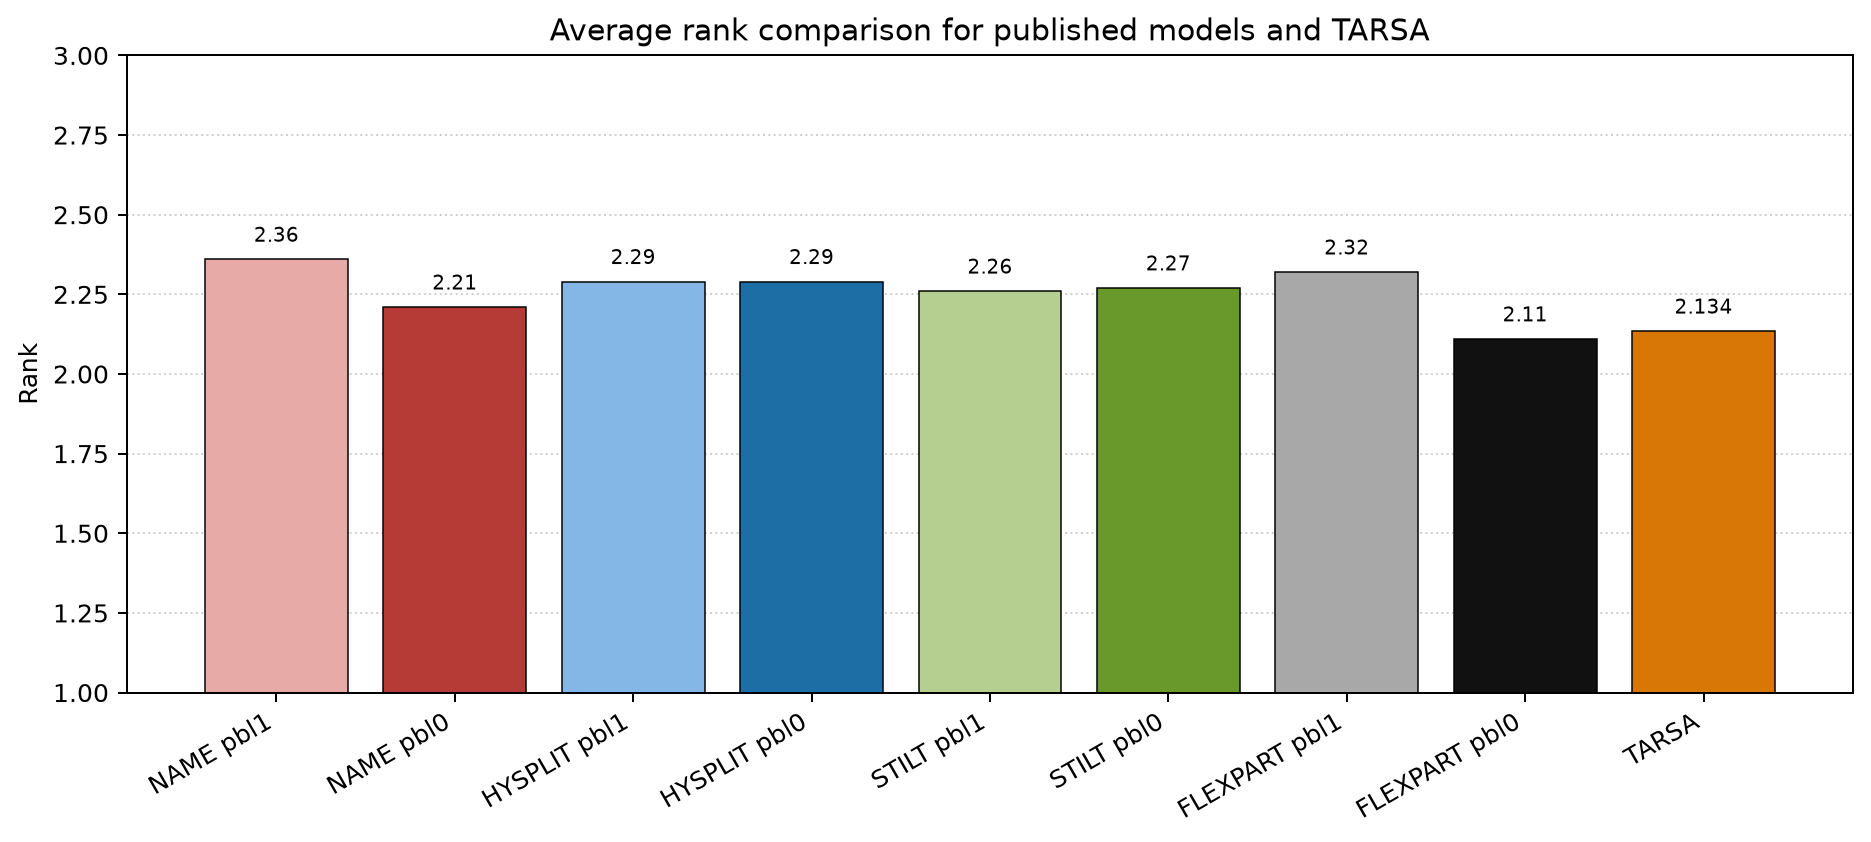
This bar plot compares the current TARSA CAPTEX rank (2.134) with the published average ranks for NAME, HYSPLIT, STILT, and FLEXPART under the pbl1 and pbl0 configurations. In this comparison, the TARSA result sits inside the published model range and close to the lower half of the average-rank cluster. This is an indicative comparison rather than a strict one-to-one benchmark because the TARSA bar uses the current repository evaluation setup. The published model averages are taken from Selvaratnam et al. (2023).
The rank combines four equally weighted terms and ranges from 0 to 4, with larger values indicating a better overall prediction:
\[\mathrm{Rank} = R^2 + \left(1 - \left|\frac{\mathrm{FB}}{2}\right|\right) + \frac{\mathrm{FMS}}{100} + \left(1 - \frac{\mathrm{KSP}}{100}\right).\]
Here R^2 is the squared correlation of paired values, FB is the fractional bias, FMS is the figure of merit in space expressed in percent, and KSP is the maximum absolute difference between the cumulative distributions of modeled and observed concentrations, also expressed in percent. Each term contributes a value between 0 and 1, so the final rank summarizes correlation, bias, plume overlap, and distributional agreement in a single scalar score.
Plume animation
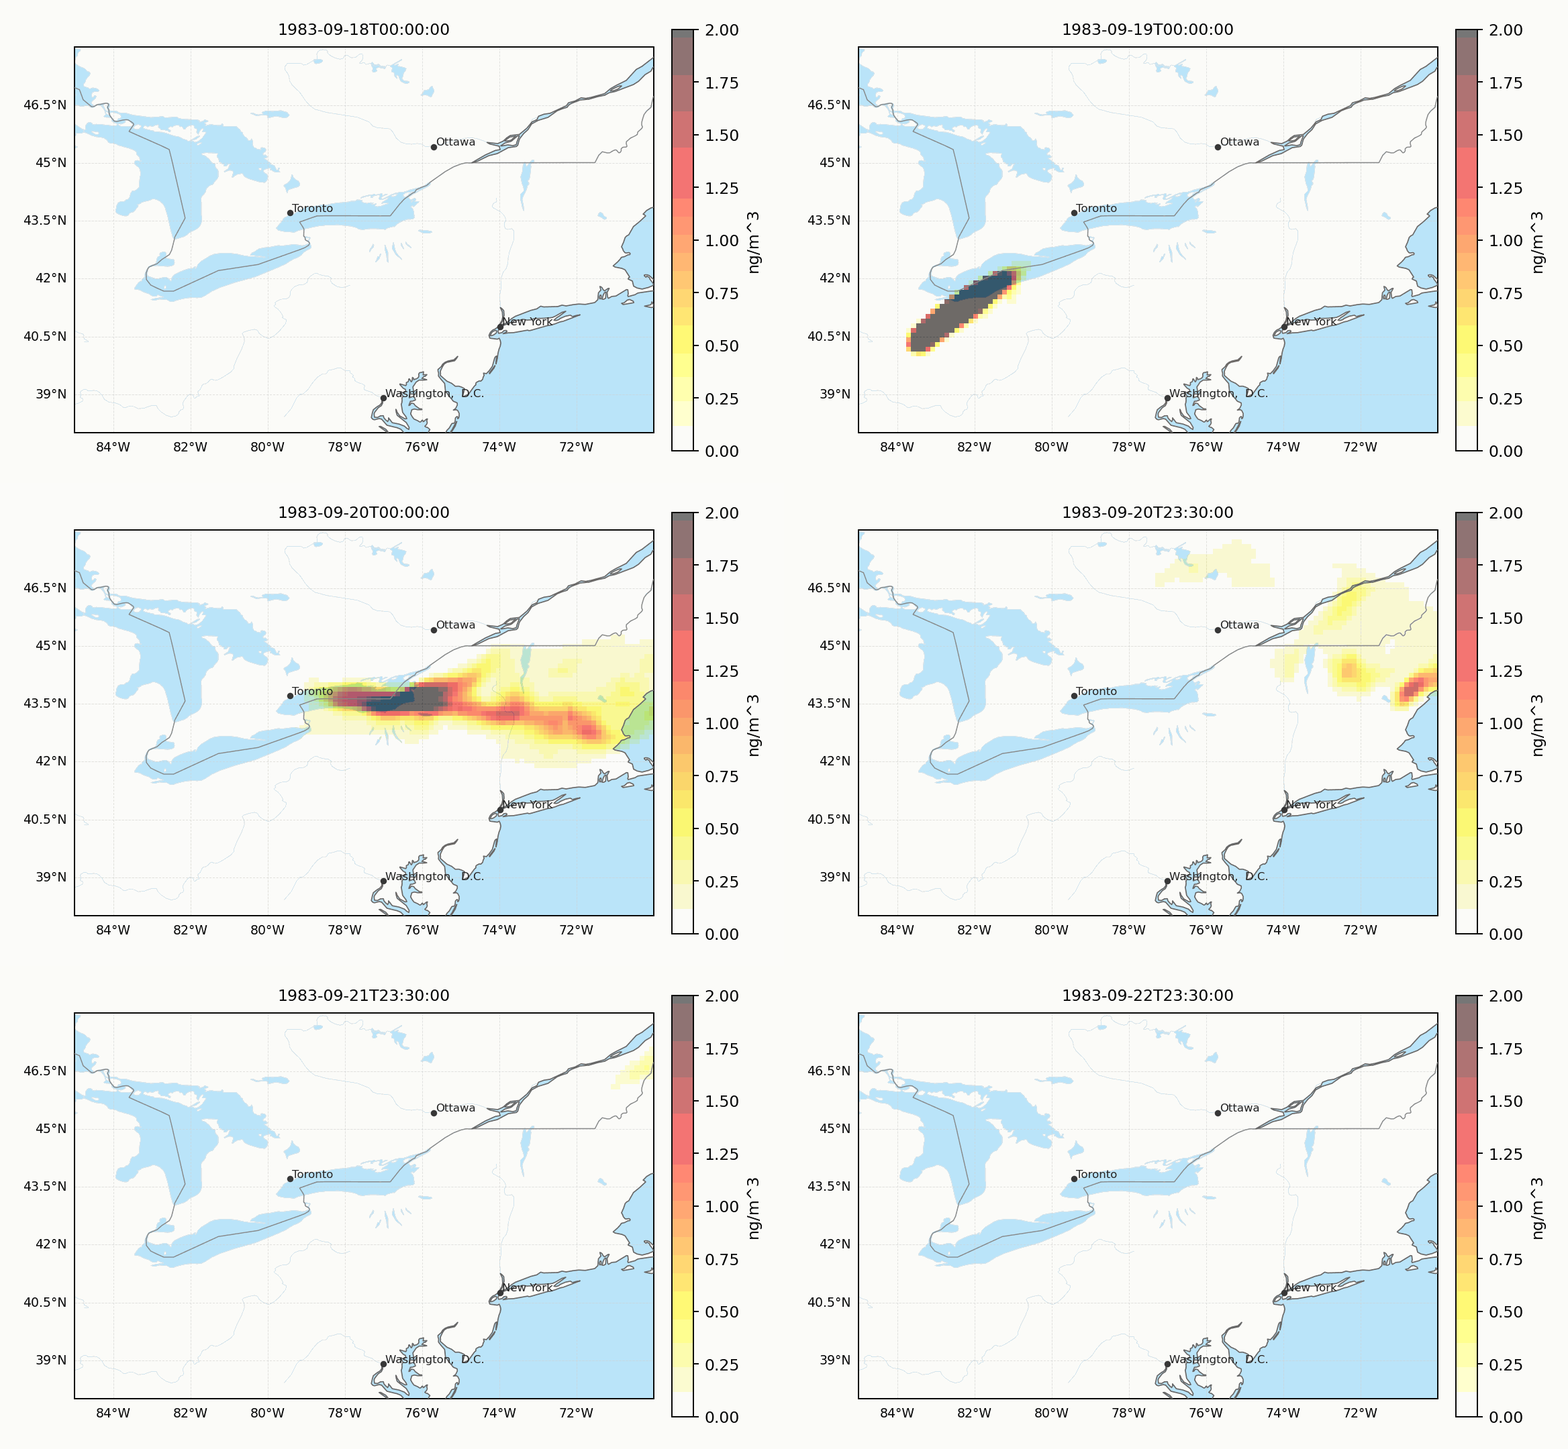
The animation shows the near-surface PMCH plume transported from the Ohio release region across the eastern North America domain. It is useful as a quick qualitative check of release placement, transport direction, and plume dilution before looking at the station metrics.
Representative station time series
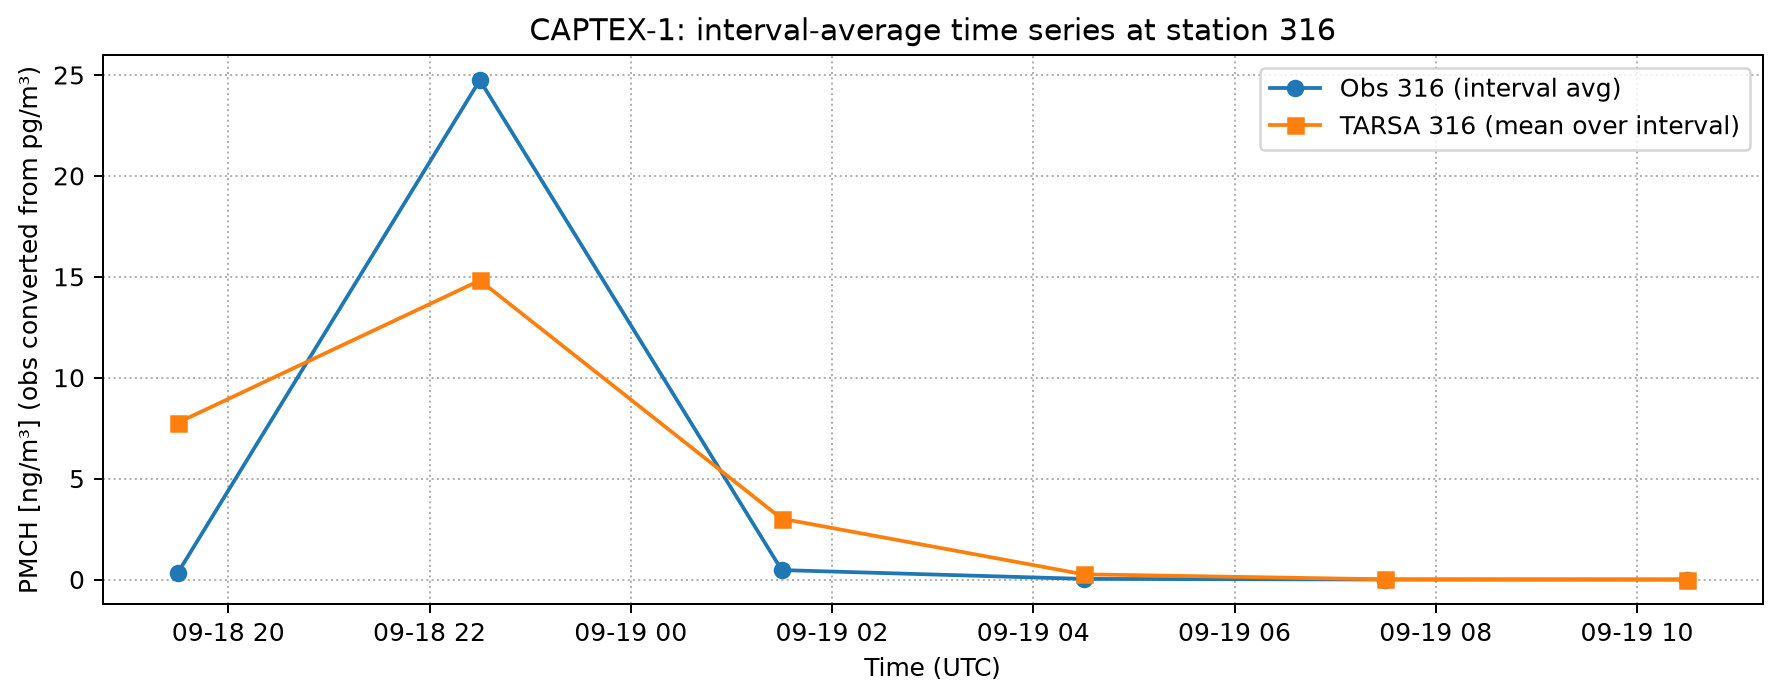
Station 316 is the strongest observed station in the current comparison set. The time series uses the CAPTEX interval-average samples and compares them to the model mean over each measurement window. The main plume passage is captured, but the peak structure is smoother than the observed interval-average maximum.
Station-wise maximum concentration
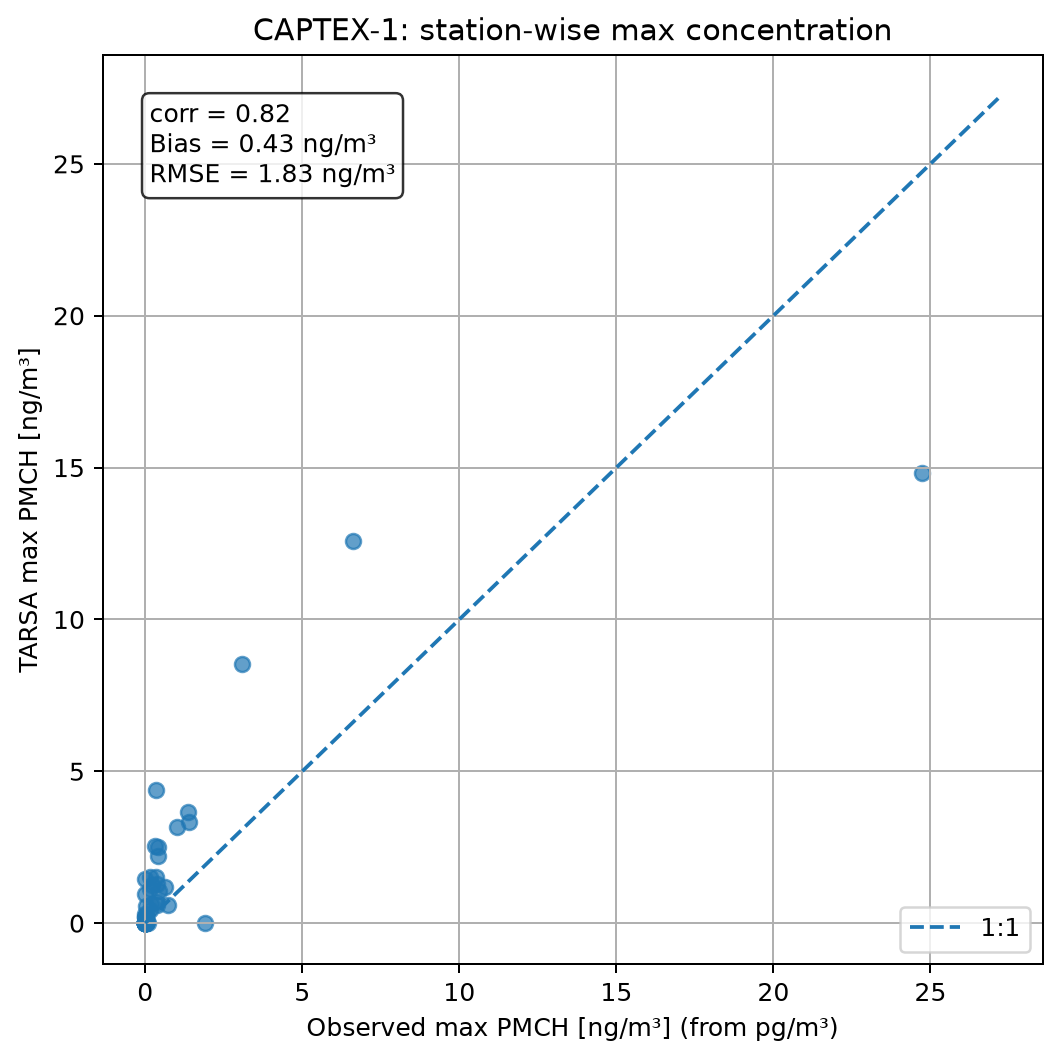
The station-wise maximum comparison shows that the strongest receptors are reproduced with the correct order of magnitude, while several secondary stations are overpredicted. For the current high-resolution baseline, the station-maximum statistics are:
- correlation
0.822 - bias
0.425 ng m^-3 - RMSE
1.830 ng m^-3
Station-wise dosage
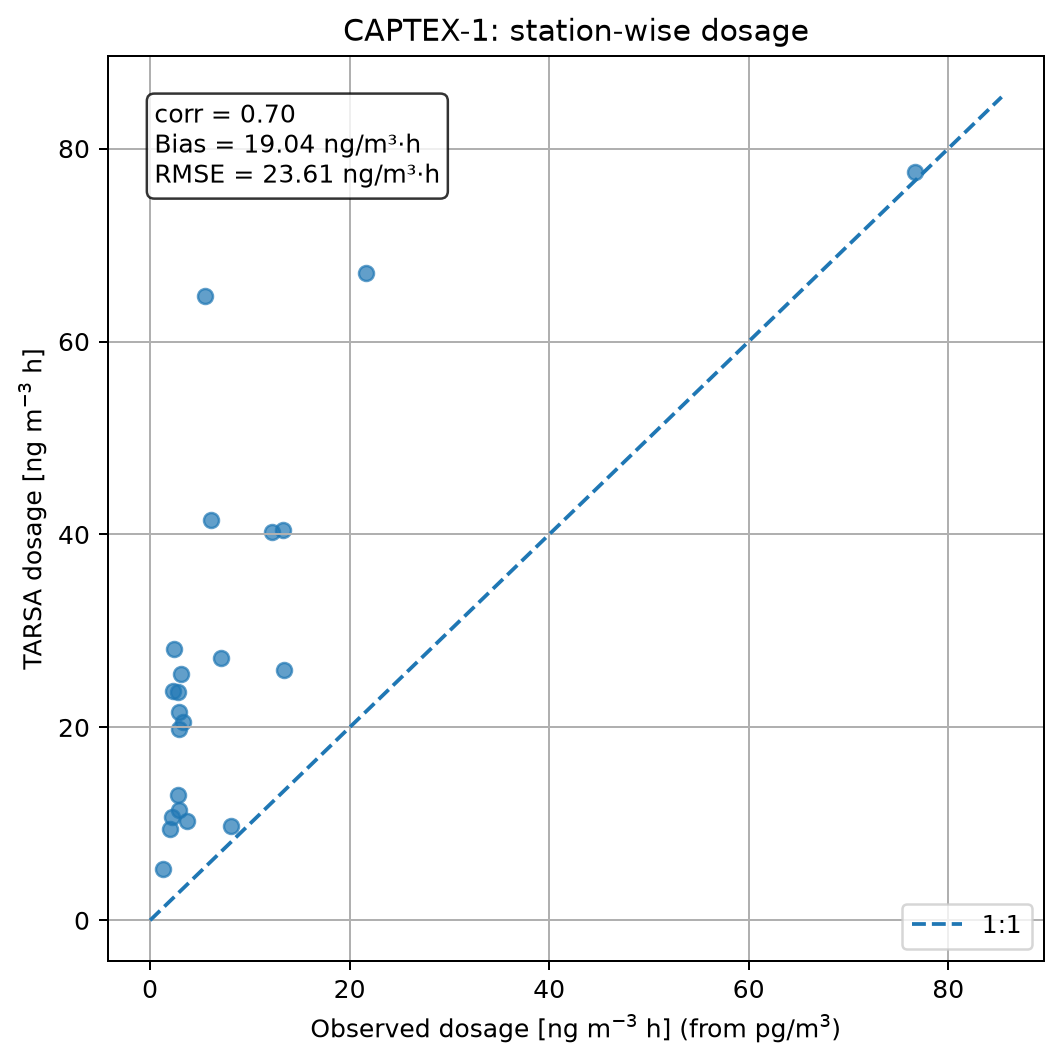
Dosage integrates the thresholded concentration over the observation window and is more sensitive to both timing and plume width than the single-maximum metric. The current dosage statistics are:
- correlation
0.704 - bias
19.044 ng m^-3 h - RMSE
23.611 ng m^-3 h
The positive bias indicates that the model tends to keep too much plume mass above the dosage threshold at several stations.
Station-wise arrival time
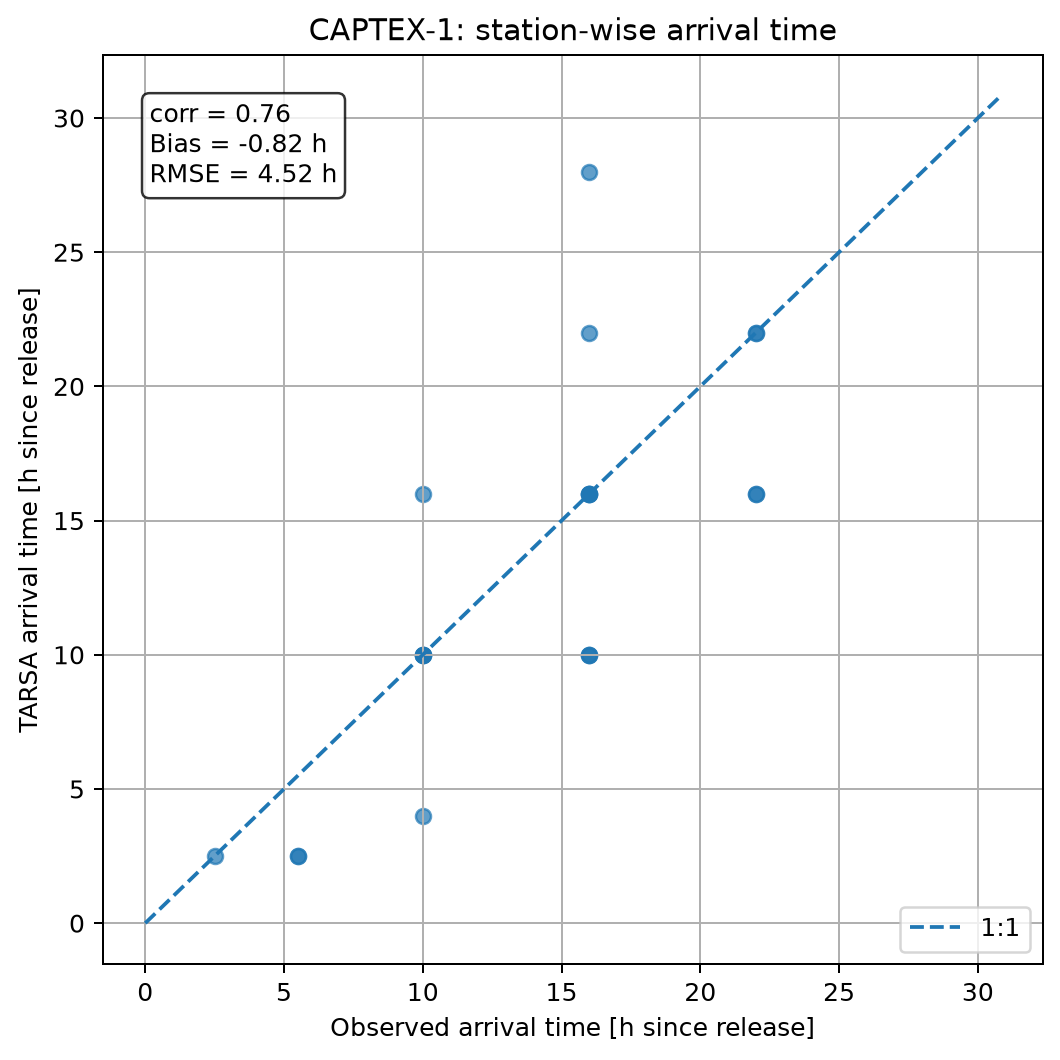
Arrival time is defined from the first interval whose concentration exceeds the plume threshold. For the current baseline, the arrival-time statistics are:
- correlation
0.755 - bias
-0.818 h - RMSE
4.523 h
The small negative bias means the modeled plume arrives slightly earlier on average, while the scatter shows that timing spread remains one of the main sources of station-to-station error.
References
Selvaratnam, V., Thomson, D. J., and Webster, H. N., 2023: Validation of the atmospheric dispersion model NAME against long-range tracer release experiments, Journal of Applied Meteorology and Climatology,
62(9),1165-1174.Ferber, G. J., Heffter, J. L., Draxler, R. R., Lagomarsino, R. J., Thomas, F. L., and Dietz, R. N., 1986: Cross-Appalachian Tracer Experiment (CAPTEX '83) final report, NOAA Tech. Memo. ERL ARL-142, NOAA Air Resources Laboratory,
60 pp.https://www.osti.gov/biblio/5695021.
Why this case matters
- provides an independent field-release comparison outside the European ETEX domain
- checks interval-average station handling, timing alignment, and observation-operator assumptions
- offers a practical sensitivity case for source placement, time step, and grid refinement
How to run
Scripts
Folder: validation/CAPTEX
Main scripts:
validation/CAPTEX/validation_captex1.jlvalidation/CAPTEX/validation_captex1_highres.jlvalidation/CAPTEX/validation_captex1_plot.py
Bundled CAPTEX inputs:
validation/CAPTEX/meas-t1.txtvalidation/CAPTEX/emit-t1.txtvalidation/CAPTEX/stations.txt
validation_captex1.jl
- downloads / prepares the ERA5 forcing window for CAPTEX-1
- injects the PMCH source with bilinear four-cell weights
- runs the base-grid forward simulation and writes TARSA fields into the CAPTEX NetCDF file
validation_captex1_highres.jl
- builds a refined tracer grid with 2x horizontal and vertical refinement
- runs the higher-resolution explicit CAPTEX configuration
- writes output NetCDF files under
data/, for examplecaptex1_tarsa_highres_dt1800s.nc
validation_captex1_plot.py
- reads the CAPTEX observations and a TARSA NetCDF output
- samples TARSA at station locations over each measurement interval
- writes PNG figures to
validation/CAPTEX/figures/ - writes the average-rank comparison bar plot for the current TARSA rank
- writes a detailed comparison table to
validation/CAPTEX/out/captex1_tarsa_comparison.csv
Run
julia --project=. validation/CAPTEX/validation_captex1.jl
julia --project=. validation/CAPTEX/validation_captex1_highres.jl
python validation/CAPTEX/validation_captex1_plot.py