ETEX-1 independent evaluation
Purpose
This case reproduces the first European Tracer Experiment (ETEX-1) PMCH release and serves as the principal independent observational evaluation in the validation suite. It tests whether TARSA can recover the synoptic-scale plume pathway, arrival timing, and station-wise exposure metrics of a real long-range inert tracer event.
ETEX-1 uses the same default sharp-plume numerics as the Gaussian verification:
- Advection: DST-Koren
- Time integration: SSP-RK3
- Vertical diffusion: implicit column-wise solve with the Thomas algorithm
- Splitting: second-order Strang splitting of advection and vertical diffusion
Configuration
The configuration follows the official ETEX-1 release:
- tracer: PMCH
- total released mass:
340 kg - release site: Monterfil, western France (
48.0583 N,-2.0083 E) - release window:
1994-10-23 16:00 UTCto1994-10-24 03:50 UTC - meteorology: ERA5
- target stability level:
CFL ~= 0.5 - no tuning or empirical mass rescaling
The repository ETEX scripts use the October 1994 window over roughly 40-60 N and -5-20 E, covering the release and about 90 hours of downwind transport.
The source is represented as a temporally piecewise-constant point release distributed horizontally with mass-conserving bilinear weights. The repository contains several closely related ETEX variants around that baseline:
validation_etex1_explicit.jl: native ERA5 grid, nearest-cell source injectionvalidation_etex1_explicit_highres.jl: horizontally upscaled meteorology and refined vertical gridvalidation_etex1_explicit_highres_x2.jl: finer horizontal upscaling plus four-cell bilinear source splitvalidation_etex1_gaussianPuff.jl: alternate Gaussian-puff / hybrid comparison workflow
For comparison with ETEX observations, TARSA PMCH is sampled at receptor locations and aggregated over the official 3-hour integration windows. The main station diagnostics are:
- mean concentration
- dosage
- plume arrival time
- plume duration
- maximum concentration
- peak time
The repository plotting workflow in validation_etex1_plot.py reproduces summary statistics using pmch.dat, pmch.cod, accepted ETEX QC flags, bilinear station sampling by default, and a threshold-based plume definition with THR_DOS = 0.05 ng m^-3.
Results
The figures below summarize the main ETEX diagnostics.
Ground-level plume evolution
Animation figure: 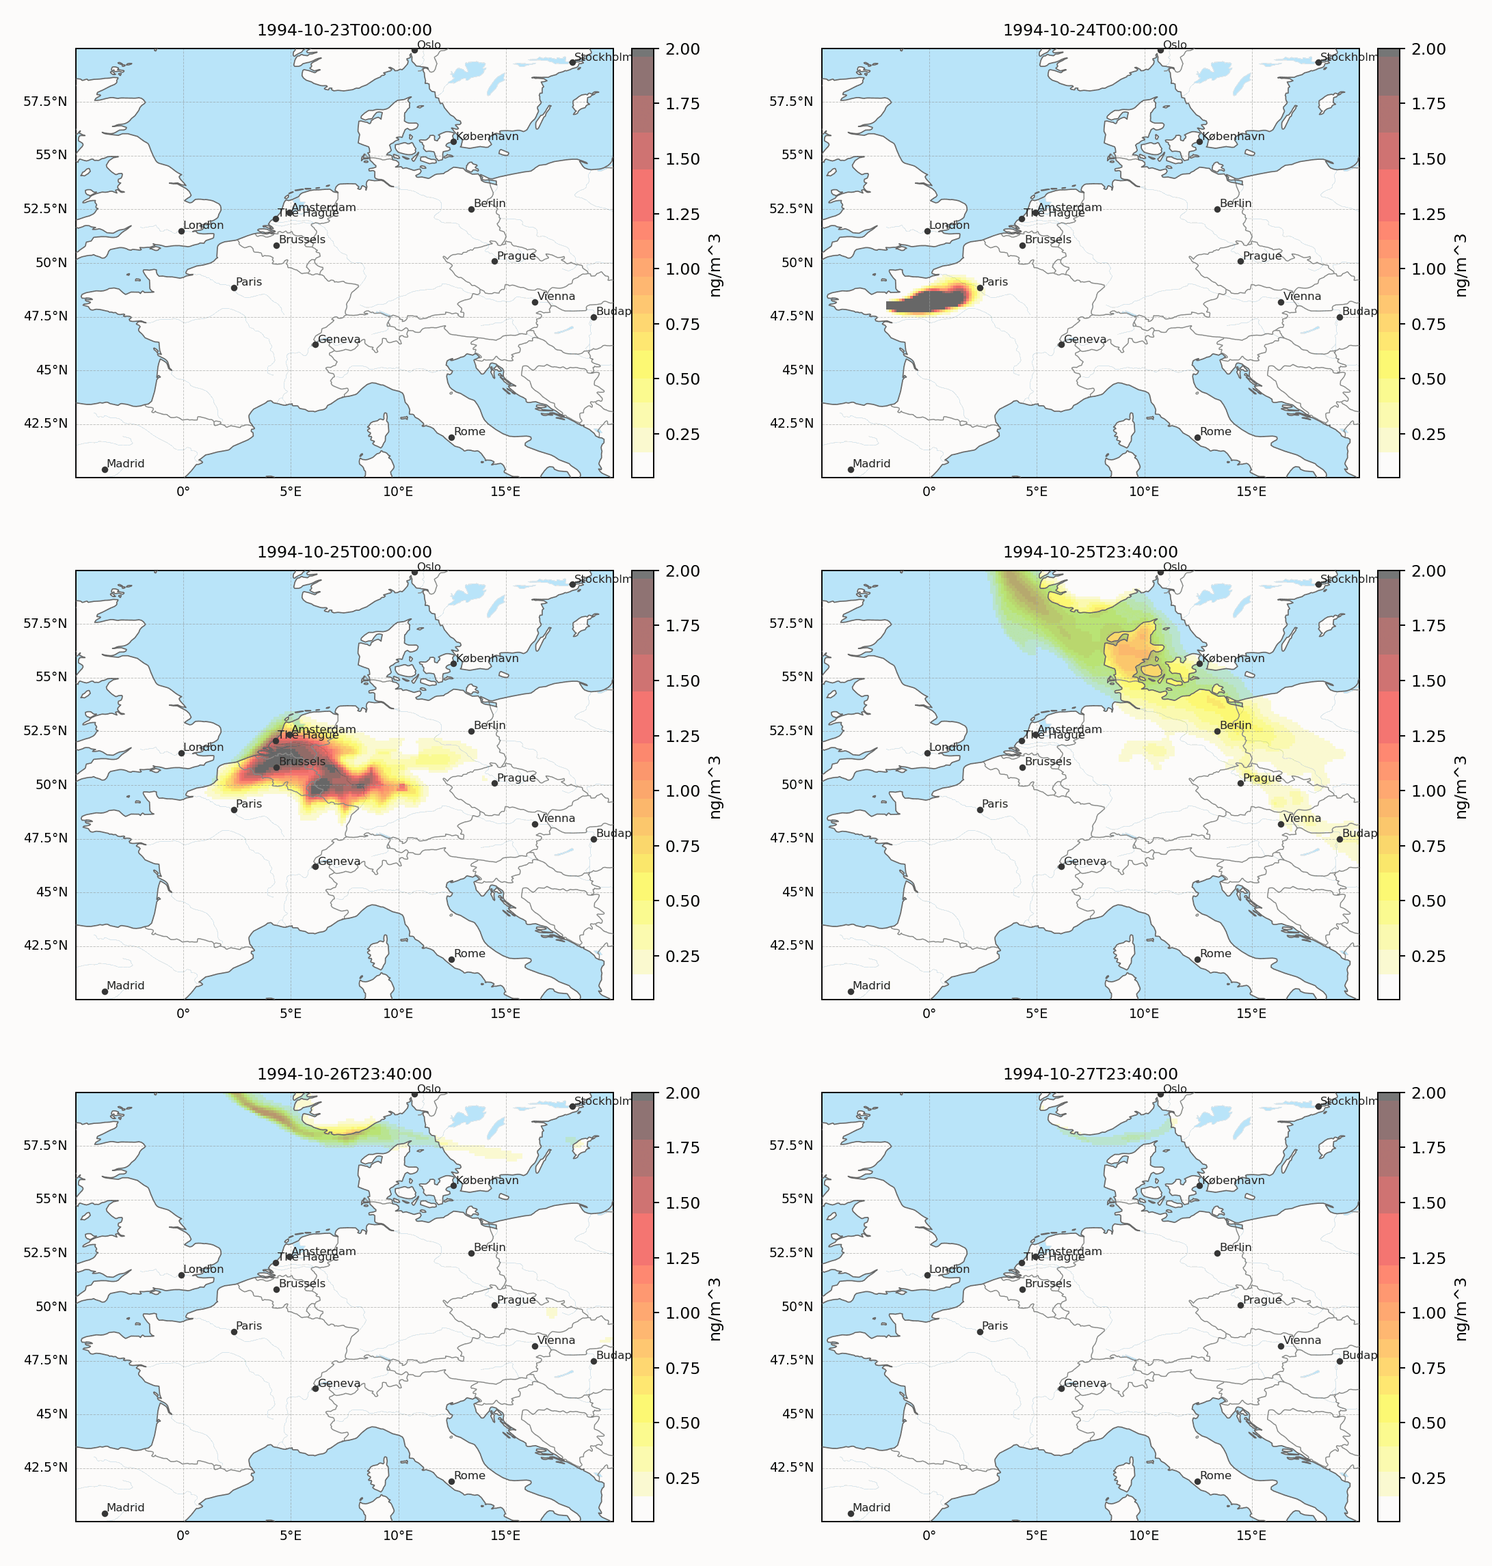
The animation shows the simulated ground-level PMCH plume propagating eastward and north-eastward from western France across western and central Europe. This is the large-scale transport behaviour that TARSA is expected to capture in ETEX-1 before any station-wise metrics are applied.
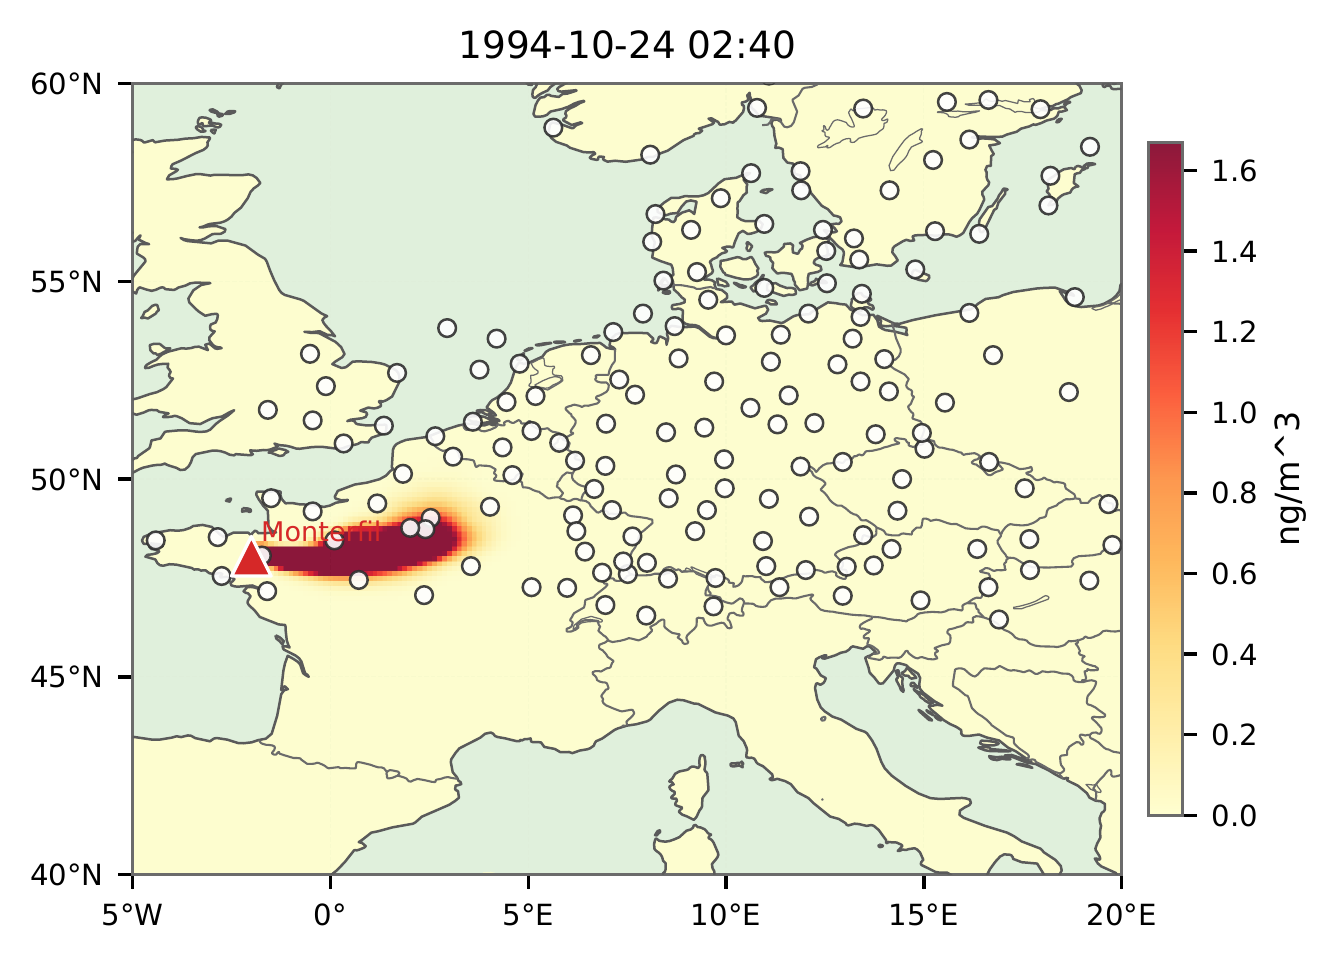
Two ground-level snapshots from the high-resolution run bracket the event. Early in the release the tracer is a narrow, intense ribbon pinned to the Monterfil source in western France:
About two days later the plume has been drawn north-eastward by the synoptic flow and spread across the Low Countries, Germany, and Scandinavia at much lower concentrations:
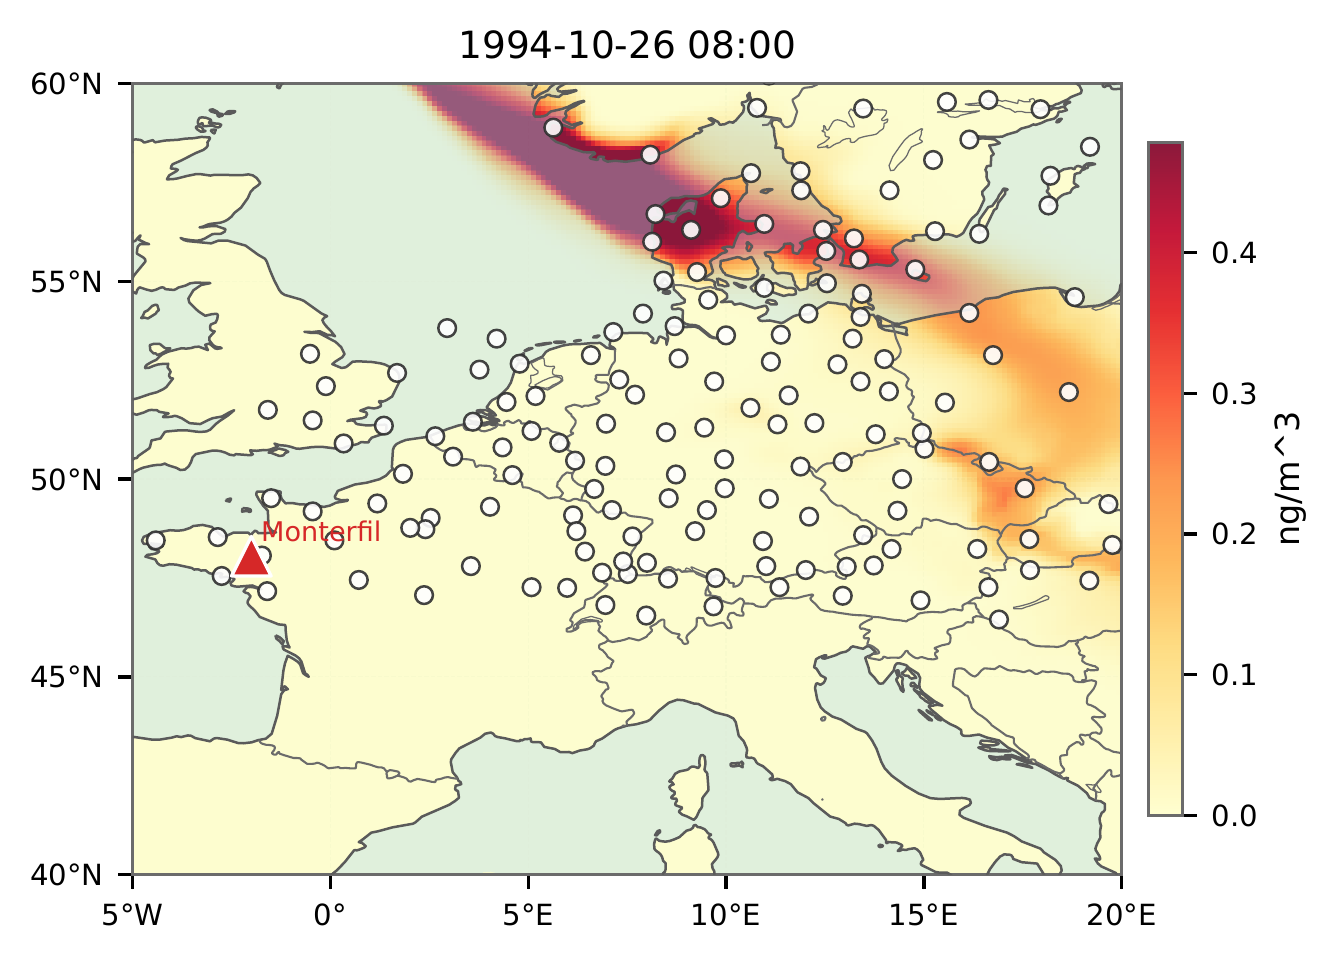
In both panels the red triangle marks the Monterfil release site and the open circles are the ETEX sampling stations; the colour scale is surface PMCH in ng m⁻³.
Station-wise scatter diagnostics
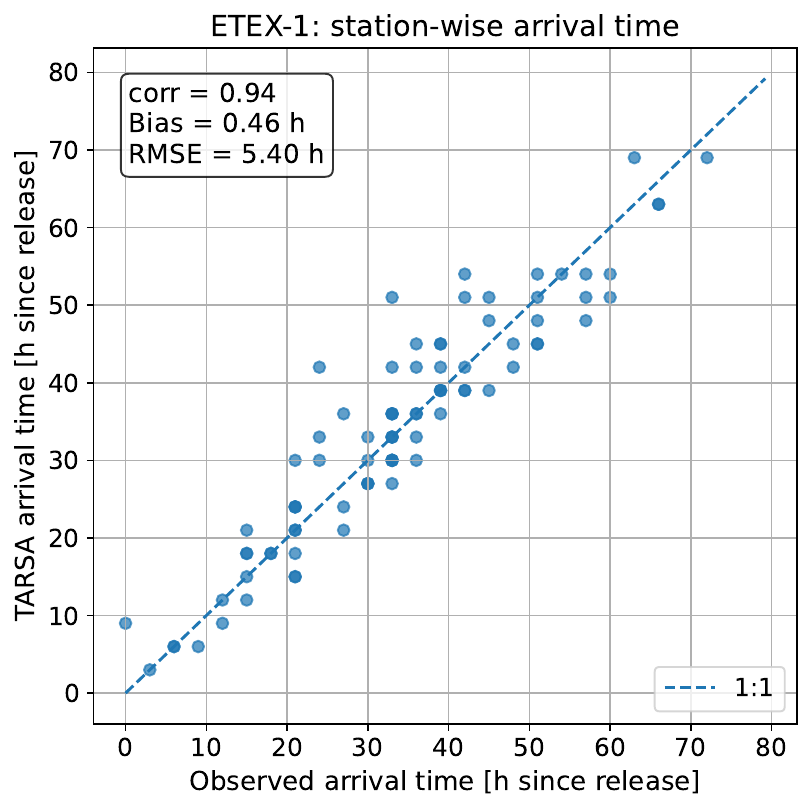
Each station is reduced to scalar exposure metrics and compared against the ETEX observations. The clearest result is plume arrival time, which clusters tightly on the 1:1 line (corr = 0.94):
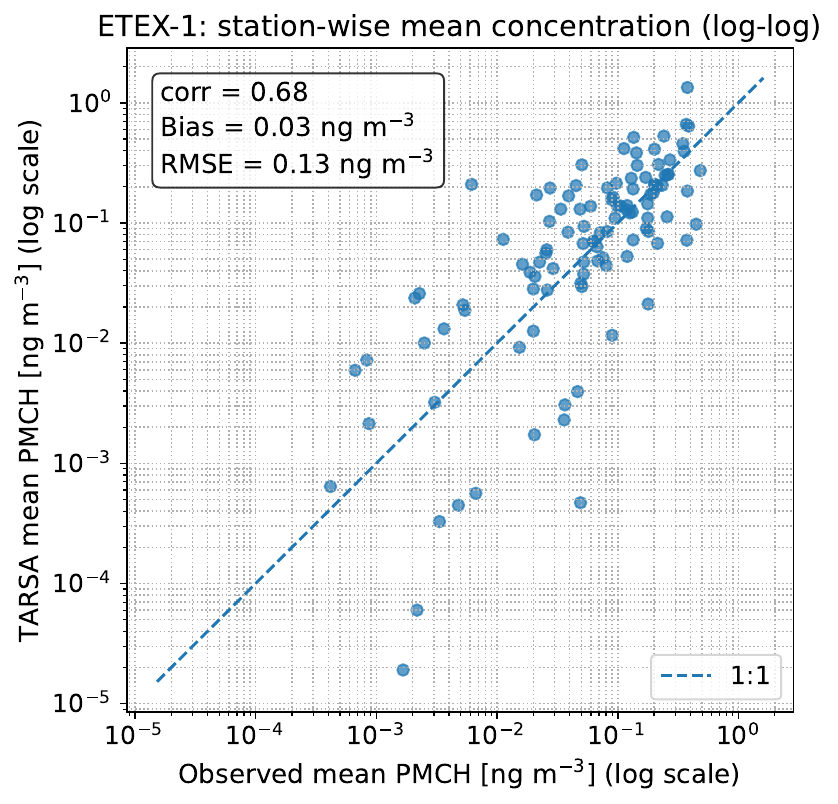
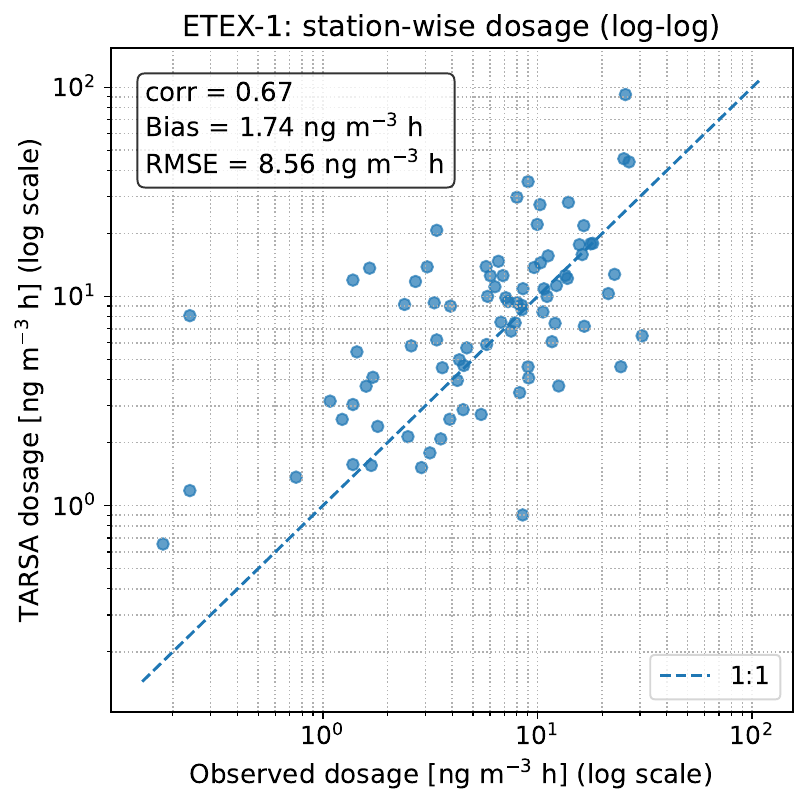
Station-wise mean concentration and dosage capture the dynamic range across roughly four orders of magnitude, with a moderate positive bias and the spread expected from coarse-grid representation of a short point release:
Station-wise maximum concentration is the noisiest metric, because peak values are most sensitive to sub-grid source structure, boundary-layer mixing, and small transport-phase errors:
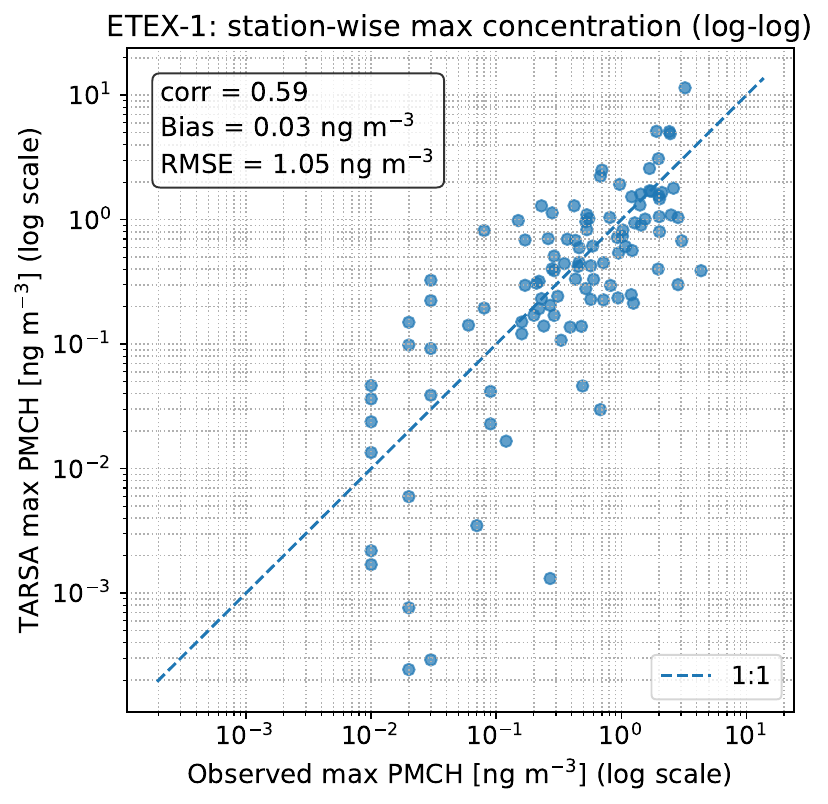
The on-figure statistics (correlation, bias, RMSE) summarise each comparison, and the consistent message is that transport timing is reproduced better than peak amplitude. Linear-axis variants of each scatter are written alongside the log-log versions under validation/ETEX1/out/.
Representative station time series
Per-station concentration histories show how the modeled plume tracks the observed passage. At DK02 (Albuen, Denmark) TARSA reproduces the arrival, the roughly 30-hour plume duration, and the timing of the peak, while underestimating the peak amplitude by about 20 %:
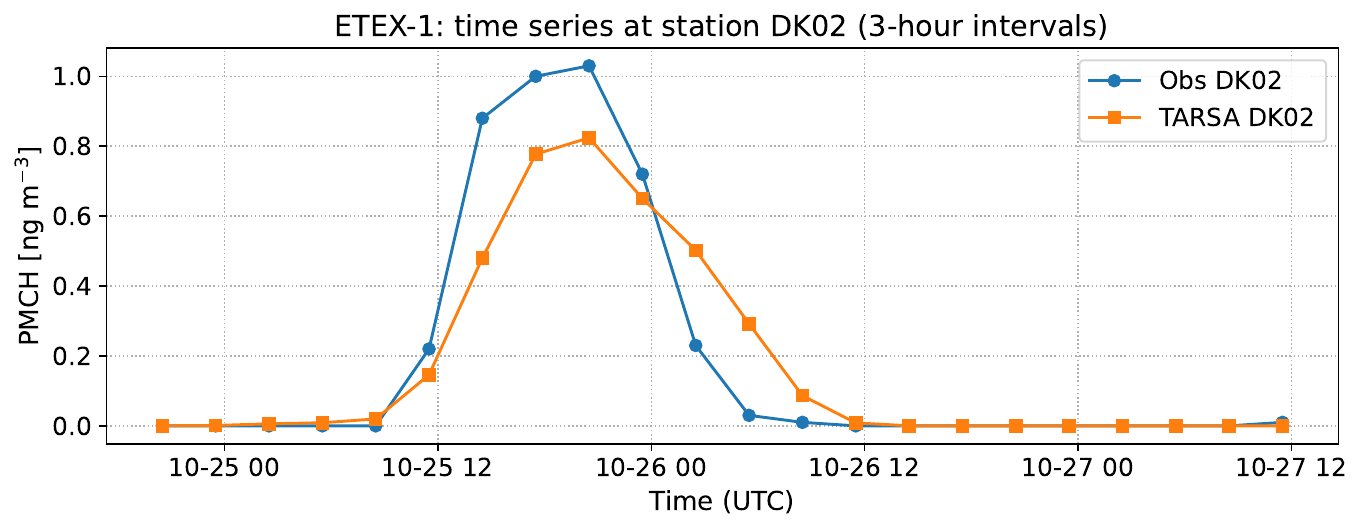
A series for any other station is produced by setting TS_STATION in validation/ETEX1/validation_etex1_plot.py and re-running it.
Figure of merit in time
FMT comparison figure: 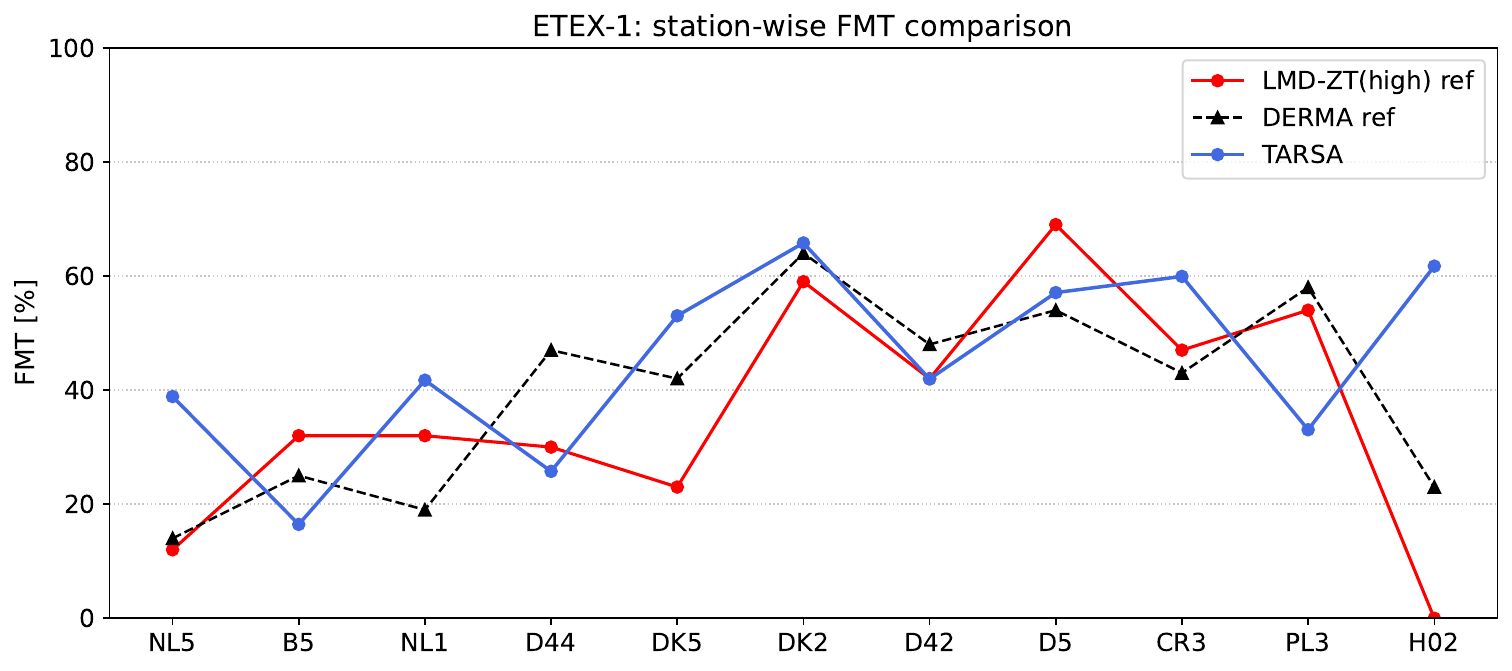
For each station, the figure of merit in time is computed from the full receptor time series as
\[\mathrm{FMT}_s = 100 \; \frac{\sum_k \min\!\left(C^{\mathrm{mod}}_{s,k},\, C^{\mathrm{obs}}_{s,k}\right)} {\sum_k \max\!\left(C^{\mathrm{mod}}_{s,k},\, C^{\mathrm{obs}}_{s,k}\right)},\]
where k runs over the valid ETEX 3-hour sampling intervals at station s. FMT = 100% corresponds to perfect temporal overlap between modeled and observed concentration histories, while FMT = 0% indicates no overlap.
The comparison plot uses the 11 stations shown in the published ETEX intercomparison figure (NL5, B5, NL1, D44, DK5, DK2, D42, D5, CR3, PL3, H02) and overlays TARSA with the reported LMD-ZT(high) and DERMA reference curves from Idelkadi et al. (2002) and Sørensen et al. (2007). TARSA reaches its highest FMT values at H02, DK2, D5, and CR3, while B5, D44, and PL3 remain the weakest stations in this subset. Relative to the two published reference curves, TARSA is close to both models at DK2, above both references at NL5, NL1, DK5, CR3, and H02, and below them at B5, D44, and PL3. This is consistent with the main ETEX interpretation: large-scale plume timing is captured well, but exact station-by-station time histories remain sensitive to source placement and small transport-phase errors.
The reference station values used in this plot were digitized from published figures, so they should be read as approximate visual benchmarks rather than exact tabulated values.
Summary station metrics
Representative filtered-station statistics, from the default mass-consistent transport run, are:
| Observable | N | Correlation | FM | NMSE | FB |
|---|---|---|---|---|---|
| Mean concentration | 136 | 0.677 | 0.693 | 1.626 | 0.261 |
| Dosage | 136 | 0.666 | 0.681 | 1.964 | 0.282 |
| Arrival time | 85 | 0.937 | 0.941 | 0.025 | 0.013 |
| Duration | 136 | 0.790 | 0.802 | 0.364 | 0.187 |
| Maximum | 136 | 0.585 | 0.641 | 2.576 | 0.046 |
| Peak time | 136 | 0.596 | 0.867 | 0.248 | 0.191 |
The main interpretation is:
- arrival time is the clearest success metric: TARSA captures the station-wise plume sequence very well
- mean concentration and dosage show reasonable large-scale skill but a moderate positive bias
- maxima are much noisier than timing metrics because sub-grid release structure, boundary-layer mixing, and small phase errors strongly affect station peaks
- duration and peak time remain useful secondary timing diagnostics, but they are less robust than first arrival
Overall, the ETEX-1 case supports the intended use of TARSA as a transparent inert-transport forward model: it resolves the synoptic plume trajectory and receptor timing credibly, while peak and dosage metrics define the present limit of the forward-only coarse-grid configuration.
Published context
For broader context only, the table below compares TARSA dosage and arrival-time metrics against two published ETEX-1 model studies: Polyphemus (Quélo et al., 2007) and DREAM (Brandt et al., 2000). This is not a like-for-like benchmark because the meteorology, grid resolution, screening, and observable definitions differ.
| Observable | Metric | TARSA | Polyphemus | DREAM |
|---|---|---|---|---|
| Dosage | Correlation | 0.666 | 0.80 | 0.65 |
| Dosage | FM | 0.681 | 0.32 | 0.509 |
| Dosage | NMSE | 1.964 | 6.27 | 1.137 |
| Dosage | FB | 0.282 | 0.93 | 0.043 |
| Arrival time | Correlation | 0.937 | 0.94 | 0.97 |
| Arrival time | FM | 0.941 | 0.90 | 0.900 |
| Arrival time | NMSE | 0.025 | 0.13 | 0.031 |
| Arrival time | FB | 0.013 | -0.023 | 0.093 |
The DERMA emergency-response model used in later operational dispersion studies is described by Sørensen et al. (2007).
Why this case matters
- provides the main independent observational evaluation of TARSA's inert-transport skill
- complements the Gaussian manufactured test by checking plume timing and pathway reconstruction in a real event
- exercises the observation-space comparison workflow used for receptor-based evaluation
- defines the current practical limit of the forward-only coarse-grid configuration for peak and dosage metrics
How to run
Scripts
Folder: validation/ETEX1
Main scripts:
validation/ETEX1/validation_etex1_explicit.jlvalidation/ETEX1/validation_etex1_explicit_highres.jlvalidation/ETEX1/validation_etex1_explicit_highres_x2.jlvalidation/ETEX1/validation_etex1_gaussianPuff.jlvalidation/ETEX1/validation_etex1_plot.pyvalidation/ETEX1/plot_tarsa_ground_map.py
validation_etex1_explicit.jl
- prepares the native ERA5-grid ETEX configuration
- injects the source on the base grid and runs the explicit DST-Koren workflow
- writes ETEX output NetCDF files used by the plotting scripts
validation_etex1_explicit_highres.jl
- builds a horizontally upscaled and vertically refined ETEX configuration
- runs a higher-resolution explicit ETEX variant with the same core transport logic
validation_etex1_explicit_highres_x2.jl
- refines the ETEX configuration further in the horizontal
- applies a four-cell bilinear source split and produces the finest checked-in ETEX variant
validation_etex1_gaussianPuff.jl
- runs an alternate Gaussian-puff / hybrid ETEX comparison workflow
validation_etex1_plot.py
- reads station metadata, ETEX observations, QC flags, and a selected TARSA NetCDF output
- computes station metrics such as arrival time, dosage, duration, maxima, and peak time
- produces the station scatter and time-series figures
- writes figures and CSV summaries under
validation/ETEX1/out/ - uses top-of-file configuration for
TARSA_NC,TARSA_VAR, output directory, and representative station code
plot_tarsa_ground_map.py
- renders ground-level plume maps from an ETEX NetCDF output
- writes figures into
validation/ETEX1/maps/ - defaults to a high-resolution ETEX NetCDF under
data/
Bundled ETEX reference files:
validation/ETEX1/pmch.datvalidation/ETEX1/pmch.codvalidation/ETEX1/stationlist.950130validation/ETEX1/release1.txt
Representative pre-generated outputs:
validation/ETEX1/out/etex1_ts_DK02.pdfvalidation/ETEX1/out/etex1_station_arrival.pdfvalidation/ETEX1/out/etex1_tarsa_comparison.csvvalidation/ETEX1/out/etex1_station_fmt_compare.pdfvalidation/ETEX1/out/etex1_station_fmt_compare.pngvalidation/ETEX1/out/etex1_station_max_log.pdfvalidation/ETEX1/out/etex1_station_dosage_log.pdfvalidation/ETEX1/maps/etex1_map_t080_early.pdfvalidation/ETEX1/maps/etex1_map_t240_late.pdf
The representative station time series uses DK02 (Albuen, Denmark).
Run
julia --project=. validation/ETEX1/validation_etex1_explicit.jl
julia --project=. validation/ETEX1/validation_etex1_explicit_highres.jl
julia --project=. validation/ETEX1/validation_etex1_explicit_highres_x2.jl
python validation/ETEX1/validation_etex1_plot.py
python validation/ETEX1/plot_tarsa_ground_map.py
References
Idelkadi, A., Hourdin, F. and Issartel, J. P., 2002, July. Validation of LMD-ZT model with ETEX-1 experiment. In Air Pollution Modelling and Simulation: Proceedings Second Conference on Air Pollution Modelling and Simulation, APMS’01 Champs-sur-Marne, April 9–12, 2001 (pp. 50-53). Berlin, Heidelberg: Springer Berlin Heidelberg.
Sørensen, J. H., Baklanov, A. and Hoe, S., 2007. The Danish emergency response model of the atmosphere (DERMA). Journal of Environmental Radioactivity, 96(1-3), 122-129.
Quélo, D., Krysta, M., Bocquet, M., Isnard, O., Minier, Y. and Sportisse, B., 2007. Validation of the Polyphemus platform on the ETEX, Chernobyl and Algeciras cases. Atmospheric Environment, 41(26), 5300-5315.
Brandt, J., Christensen, J. H., Frohn, L. M. and Zlatev, Z., 2000. Numerical modelling of transport, dispersion, and deposition: validation against ETEX-1, ETEX-2 and Chernobyl. Environmental Modelling & Software, 15(6-7), 521-531.